 _
_Viewed 10054 times | words: 6644
Published on 2024-03-28 22:55:00 | words: 6644
As you know, I like to make experiments both
_ to then "thesaurize" the results (positive and negative)- expand/refresh tools for my activities
_ following feed-back and lessons learned on the operational use of the above.
It is a matter of continuous learning / continuous improvement.
The latter means: something I did that, in hindsight, could have done better if I had considered all the insights (information I had before but discarded through an assorted array of biases- choices).
And means also something that, following what happened overall at the local or general systemic level, would have been feasible with the same resources and better results/benefits delivered to all the parties involved.
If you read my articles online (not just in this section, where the purpose is to share tools and applied concepts that could be useful to others), you know that used the COVID lockdowns not to play videogames, but...
... to update and expand my skills, both by doing long postponed experiments, and by e.g. trying to see what I could do with open source and free computing resources online that used to do offline.
The "storytelling with business data" is something that did since the 1980s, first in political activities, then in the Army while delivering a training that had designed, and eventually while designing and delivering training curricula on technologies, processes, organizational changes, and of course also sales presentations (albeit focusing on managers) on the above, in English, French, Italian.
This article is both to share some reusable concepts and use some of my more recent (and ongoing) experiments, as well as pointers to background material that found useful before, during, after specific missions for customers or partners.
The sections in this article:
_ preamble: experiments
_ storytelling- the concept
_ storytelling- the practice
_ storytelling- the background
_ further investigations.
Preamble: experiments
This time, I had planned a two-parts article, the first part within the series CitizenAudit, the second part on within Business: Rethinking, as I shared on 2023-03-22 morning on Linkedin:
"those who saw the first draft of the article that is going online this week-end know that it was aimed for the CitizenAudit section of my my website https://robertolofaro.com/index.php?section=citizen-audit
but, while walking after drafting the first part in the morning, and the second part in the afternoon, completed the day by attending in person a conference, and at the same time attending remotely conferences and workshop that I had followed along the day
hence, while sipping a pint and reading a book after the last conference, saw that that draft was evolving into something wider therefore...
... will go online, but a bit different and into a different section, the one focused on organizational support, where I share actionable lessons learned and ongoing projects/products activities
https://robertolofaro.com/index.php...
unfortunately yesterday I had to skip a conference on storytelling with data, but the article will be anyway around that theme, as it is something I had to do since the 1980s for my decision support system model activities have a nice week-end!">
A further change: instead, this article will be stand-alone, as will be followed by a completely different string of publications later this year.
All about the theme within the title: storytelling.
Therefore, consider this article a short (well... not-so-short) example and sharing of concepts that will discuss later.
It was initially intended to go online on 2024-03-24, but then, having completed an update on my ECBSpeech webapp, had a look at the ECB website in preparation of my weekly Monday evening release.
As I wrote on Facebook on 2024-03-24:
" as General Eisenhower is attributed saying...
...it is the planning, not the plan- as any plan does not survive contact with reality
hence, will postpone the release of the article on storytelling to Tuesday morning
after updating tomorrow as usual the ECBSpeech webapp following the change in site architecture at ECB, presenting in a single entry point more material, and some content added this week that can be useful within the scope of the article
anyway: I liked the change except for few details- makes easier to access all the publications from a single entry point, following a reverse chronological approach
you can see the new publications entry point (for the ECB) here: https://www.ecb.europa.eu/press/pubbydate/html/index.en.html it allows to search by when, what, who
PS instead my search by tag cloud updated each Monday evening is always at https://robertolofaro.com/ECBSpeech "
As I wrote above (and in previous articles), but maybe you also saw within datasets on Kaggle that shared since 2019, from 2019 started working along different data lines.
The experiment described in this article "blended" two streams:
_ the ECB communication side, shared via ECBSpeech
_ the impacts of COVID on business in Italy, via financial reports (ongoing- see e.g. Organizational Support 10: strategy-oriented KPIs in a data-centric societyOrganizational Support 10: strategy-oriented KPIs in a data-centric society).
The "convergence" implies:
_ looking at both in 2019 and 2021
_ adopting specific approaches linked to the specific information provided in each case.
This to explain the "context" of this article (and its sources).
Now, time to start sharing my concept about storytelling.
Storytelling- the concept
Let's start with a small example: we had since a while the Terminator narrative, the "singularity" narrative, and other neo-Luddites narratives about the risks of Artificial Intelligence becoming too smart for our own sake.
Starting, of course, as all the neo-Luddites narratives: how many jobs will be lost due to the new technology.
Curious that few uttered that about smartphones, which allowed to have just one single object taking the role for over a dozen different devices.
Yes, many smaller companies did not find anymore customers for their products, as now anybody can have the same (say, a compass, a camera, an audio-recorder) within their own smartphone, and many of the (fewer) surviving ones had to refocus on "prosumers", those consumers who actually can afford and want semi-professional tools (that fairly exceed in features what professionals could get one or two decades ago).
Personally, I think that it is at best a partially true concern: many of those who install countless applications replacing countless devices on their own smartphone would have never purchased those individual devices.
Anyway, the issue should be what we apparently forget: digital and green transitions need data, and continuous adjustments, to be able to better use resources.
Which, in turn, require the ability to process those data where and when appear- fast.
Something that is not feasible by having humans process those data: too many, too fast, needing a feed-back too soon and too often.
Hence:
_ we need AI or any other form of "as smart as humans but much faster"
_ many of the past jobs will not simply replaced- will have to evolve
_ there will be a new workplace structure, integrating both humans and AI
_ this all will demand new concepts of both organization and work.
Again: there will be time and place to expand on these concepts- this article is just about the storytelling element.
Anyway, if you read these phrases so far, you would not be surprised by the link of an article that decided to share, and a key element that it highlights:
" AI to create a half billion new jobs - here's why
Over the next decade, generative artificial intelligence will replace some jobs. But as has always been the case with revolutionary technologies - from the steam engine to digitization - it's destined to create far more jobs than it eliminates."
Storytelling is a buzzword that everybody uses
Anyway, even before ChatGPT, the Internet already since the 1990s brought to the surface "ghostwriting galore"- too much, too many, and...
... all the same.
On the storytelling side, some hired creative copywriters who actually created a "story", sometimes with good results.
Actually, my own United Hamster Front was created in early 2007, as whenever stage6.divx.com was having issues a message showed "we are feeding the hamsters"; my aim: to help lower the trolling of those who shifted from complaining to verbal abuse.
The inspiration: what the creative copywriter from DivX proposed and was accepted- that "we are feeding the hamsters".
Often, the human side of the Internet actually is just a visible escalation of what I saw also as a kid: piling up on negative, not on positives.
Try criticizing somebody, and suddenly many will join; try supporting, and often some will question why you praise, and anyway start discussing how you forgot the negative sides.
So, also to avoid mistakes, apparently many started following the same courses- or copies of the same courses, as I shared few days ago on Linkedin:
" waste it wisely- and do not let others choose how to waste it
Will expand more within the article going online this week-end
But it is quite puzzling how many worry about AI taking over also "knowledge worker roles"...
...while since years (pre-ChatGPT)...
... everyday both my mailbox and Linkedin stream get a "quota" of marketing messages that replicate the same communication patterns and devices probably derived by the same course or its copycats...
... while pretending to be "the one and only"
Uniqueness, as understatement, is to be spotted by others, not proclaimed by wannabes with too large a ego for their boots
So, will have to prune again my subscriptions to mailing lists
stay tuned "
In our GenerativeAI times, now even Linkedin offers to have AI rewrite your own posts.
Anyway, also before GenerativeAI, I found that e.g. many articles online had negative value added: absorbed your time to share what, if you had been in the same field, had already read elsewhere.
GenerativeAI, notably within the technological and business fields, has had so far a multiplying effect: lost count of how many times started reading articles (or even papers) on some websites that usually charge to let you read what other post...
... just to see after few paragraph as those 5 or 10 pages had nothing to contribut, not even links to further material- just rehashing what I had read countless times.
As I wrote above, routinely keep reading what mailing lists provide for a while, after reading few posts, brochures, or watching video presentations.
Then, if it starts sounding as more of the same, or just creating zilch value but recycling somebody else's value to keep you in the loop as a potential customer, I use that magic "unsubscribe" link.
Storytelling is useful- but even a parody has to deliver something different from the original, not just your own delivery of the original.
Otherwise, sounds like those 2000s "independent" or "streaming" sci-fi movies that actually lifted a lot from 1950s-1960s shows and movie.
Consider this section my "position micro-paper on storytelling in business and organizations", derived from first tons of readings, then meeting and living in various cultures, then studying more formally cultures... all that before I turned 15.
Political activities, up to 16 just in Italy, from 17 also interacting abroad were just an extension of a long journey.
I think that would not have been useful for my further business activities if I had not had the time before to do that observation and study phase.
In business, what we now call storytelling has always been part of what makes some good at building business relationships- or even just selling.
Because, in my view, storytelling is not just, as many consider, about "telling" what you define "your story"- but also tailoring your story to your audience.
Without losing touch with what is your own "guiding light": empathy is not opportunistic manipulation.
Actually, the latter is useful in one-off business relationships (e.g. selling to non-repeat customers, albeit only if you do not rely on recommendations for further business).
I met people who say the different story for each audience flipping the perspective each time: impressive how they can find the key to immediate approval.
Pity that then you just need to connect some of those audiences to get that shortcircuit: as some politicians that still behave as if they were in the XIX century, telling a different perspective to each audience, as if they had no way to share or compare what they had been told.
My experience is that sometimes storytelling is useful if really "close to home" with the audience.
Instead, sometimes is better to have "stock stories to tell", to adapt to each audience by integrating, while delivering the story, elements that resonates.
In other cases it is even better to just deliver the "stock story" off-the-shelf, to unbalance and make think the audience.
Caveat: consider the context before using the latter, or otherwise you generate different layers of perception through different slices of the audience- that then will require significant effort to converge into a shared understanding, if your storytelling was aiming to generate a consensus on following a specific behavioral pattern.
I discussed those themes within "Strumenti", a mini-book that discussed how to integrate within corporate and advocacy communication social media in a proactive way; in 2024, it is over a decade old, but some principles did not change.
I will share in the last section of this article pointers to material decades, hundreds, or even thousand of years old- which still proved repeatedly to be useful even in the XXI century.
I keep writing: having "patterns" in your toolbox does not imply that you will try to use whenever you can- only whenever you must or makes sense.
At the same time, to keep your ability to use them alive, you have to... keep using them, so that the associated skills and "Pavlovian reflexes" are readily available when needed.
Something that, at the start of the COVID pandemic, was blatantly lacking: some countries, such as Italy, complained later about having old plans.
But, frankly, it is not really a matter of old or new plans, but of being able to implement them.
And not just Italy apparently forgets to include within the budget for each investment also its "lifecycle", i.e. blending what is called CAPEX with associated (and mandatory) OPEX, plus all that will be needed until you dispose of what was part of your investment.
just look at a small example from this article:
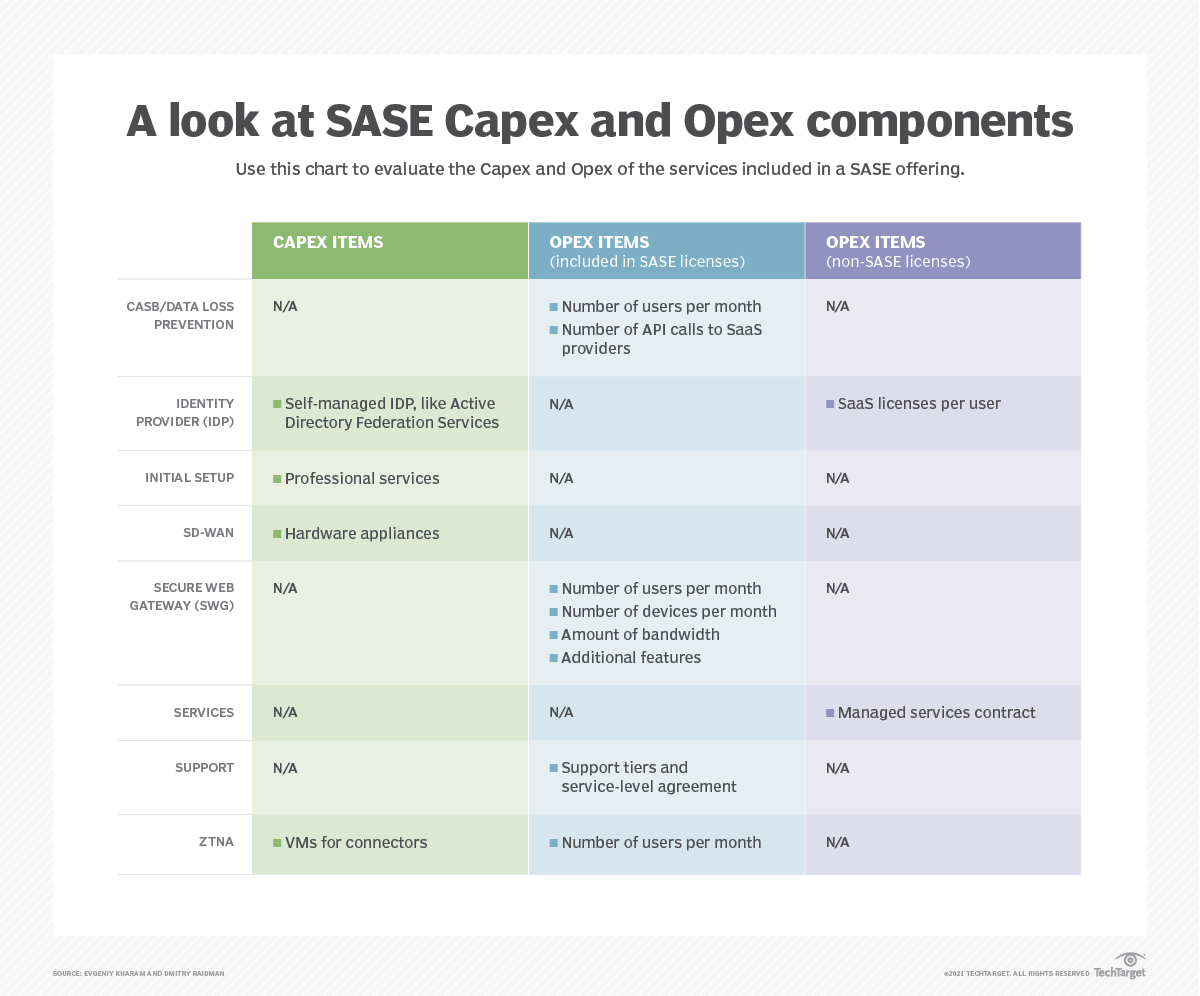
This picture is more comprehensive than many I saw, but still lacks the information about "contextual CAPEX and OPEX", i.e. what enables a specific organization to phase-in the new service/product/whatever (and probably also a phase-out of what it replaces), plus initial and continuing training needs (e.g. based on the staff turnover), plus costs associated to "operational readiness maintenance" (e.g. exercises on processes and activities not used frequently, crisis management, etc), and, why not, also the "costs" in terms of subtracting "operational" time from existing staff to cope with both the transition and the learning/relearning/unlearning activities (and associated temporary staff).
This section started with an example of storytelling, based on the fear of AI (and change, by extension), and then evolved into a discussion on the use of storytelling as a tool within a process of change.
As discussed within strumenti long ago, while being able to "tell a story" is useful, to be able to do so not just when you decide, but also when you have to (e.g. in crisis management or to move forward a negotiation) implies a degree of preparation.
The title of that book in Italian is "strumenti", "tools"- as in my experience collecting tools and behavioral patterns that could be reused implies also collecting the associated communication patterns.
Their use then requires considering not just the "instantaneous delivery", but also the associated potential impacts and evolutive scenarios.
In the next few sections, will get back to the experiment that described within the preamble.
Let's start with the narrative per se, and then move onto the other dimensions listed within the table of contents of this article: the underlying data and the associated rationale transforming data into a narrative.
Storytelling- the practice
Unless you were on another planet, you know what happened in 2020.
In 2019, in the EU we had some issues, but, looking at the communication from the ECB, it is business as usual
Looking just a press releases, the closing items of 2019 for the ECB were business-as-usual:
_ 2019-12-12 Monetary policy decisions
_ 2019-12-20 ECB appoints Petra Senkovic as Director General Secretariat and Pedro Gustavo Teixeira as Director General Secretariat to the Supervisory Board
January 2020 was more "innovative", but still "ordinary business":
_ 2020-01-21 January 2020 euro area bank lending survey
_ 2020-01-21 Central bank group to assess potential cases for central bank digital currencies
and, on January 30th, the focus was another Brexit step:
_ 2020-01-30 ECB welcomes ratification of agreement on orderly UK withdrawal from European Union
The first press release explicitly focused on COVID was in March, few days before Italy announced its first lockdown:
_ 2020-03-04 ECB announces operational precautions linked to coronavirus
And then, it was a flood, mirroring initiatives taken by the EU at large.
Will not share a list of the press releases directly or indirectly connected with COVID, but the summary of 2020 across the other communication items is quite significant:
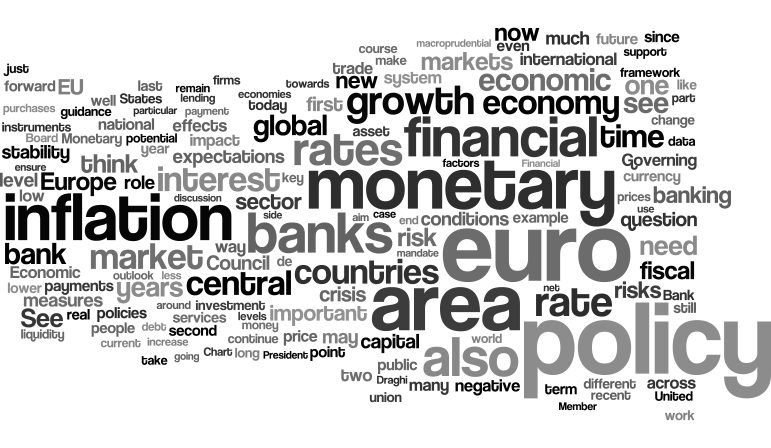
In 2021 did improve, but "pandemic" still has significant visibility, and while "liquidity" was part of the key themes in 2020, "inflation" started taking its place.
What 2020 showed was how finance is not an island within a complex society.
Actually, you could have watched the movie 2011 movie "Too Big To Fail" (or read either the associated book or the material from Basel), about the 2008 crisis, to see how a manufacturing company, General Electric, was affected by side-effect of mortgages given to retail banking customers to purchase homes way beyond their financial means.
The second half of the XX century converted globalization into hyperfinance, further increasing complexity, and stretching resources so thin that a temporary disruption of supply chains can become almost a tipping point shifting toward a chaotic continuous set of ripple-effects.
Communication impacts shown within the "reach the audience" side of ECB communication, the Podcast and Blog, showed how large a share was taken by COVID and related since 2020- and still is here:
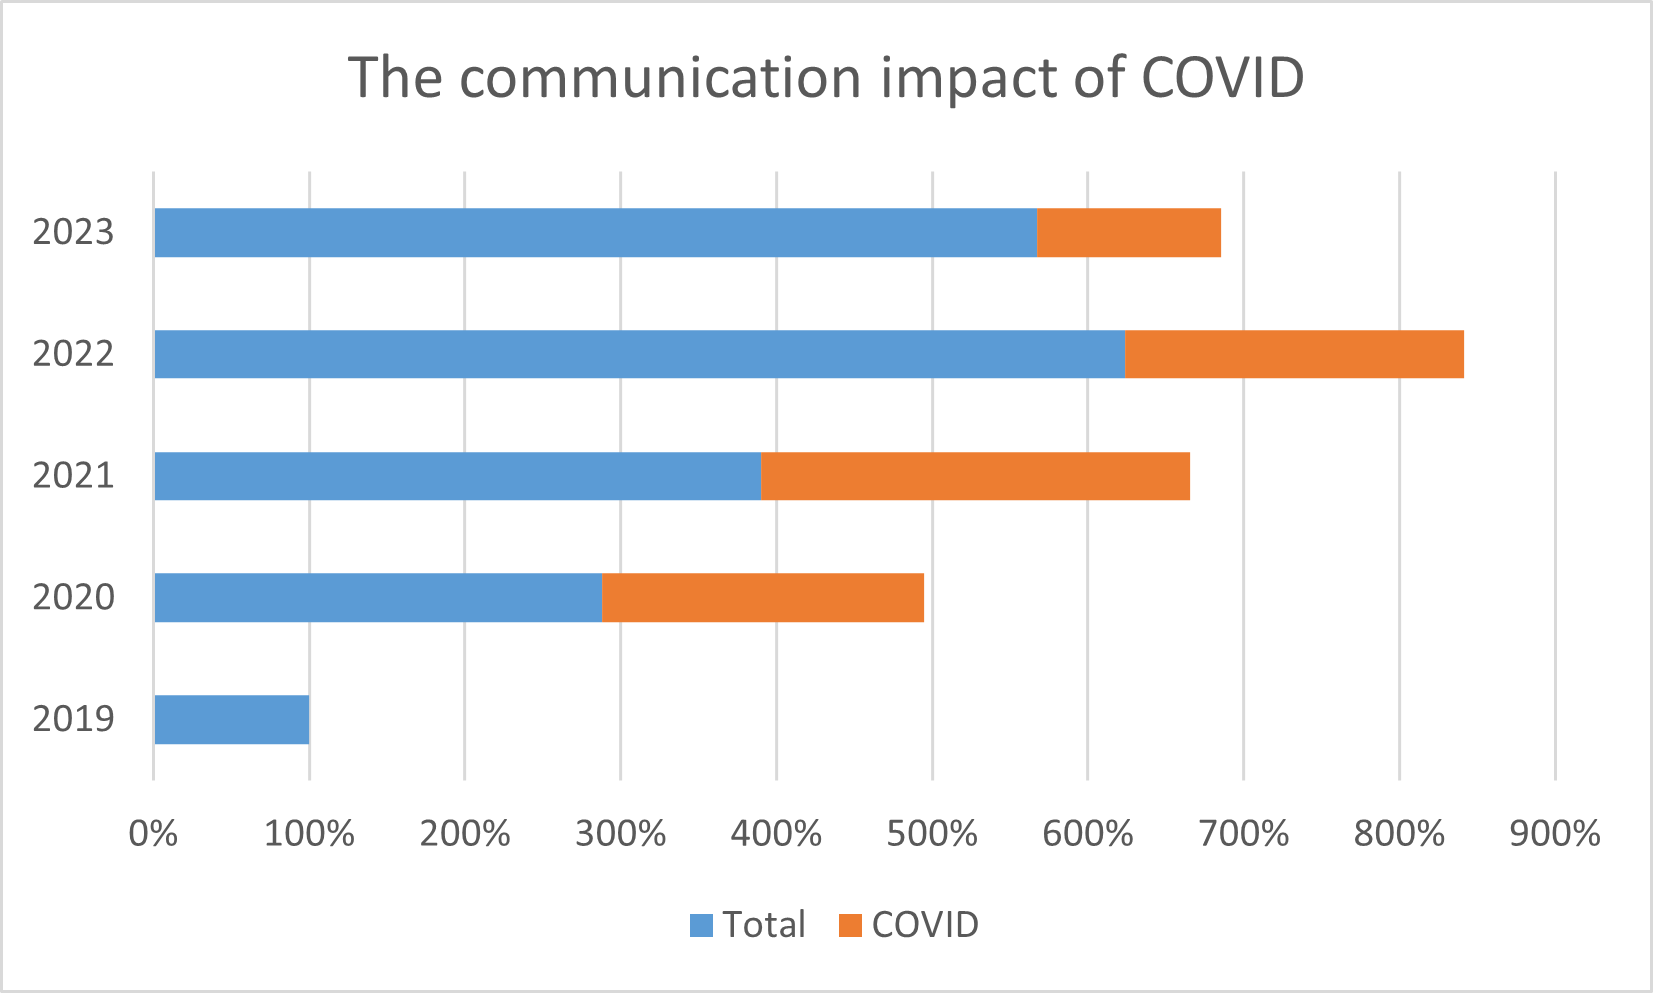
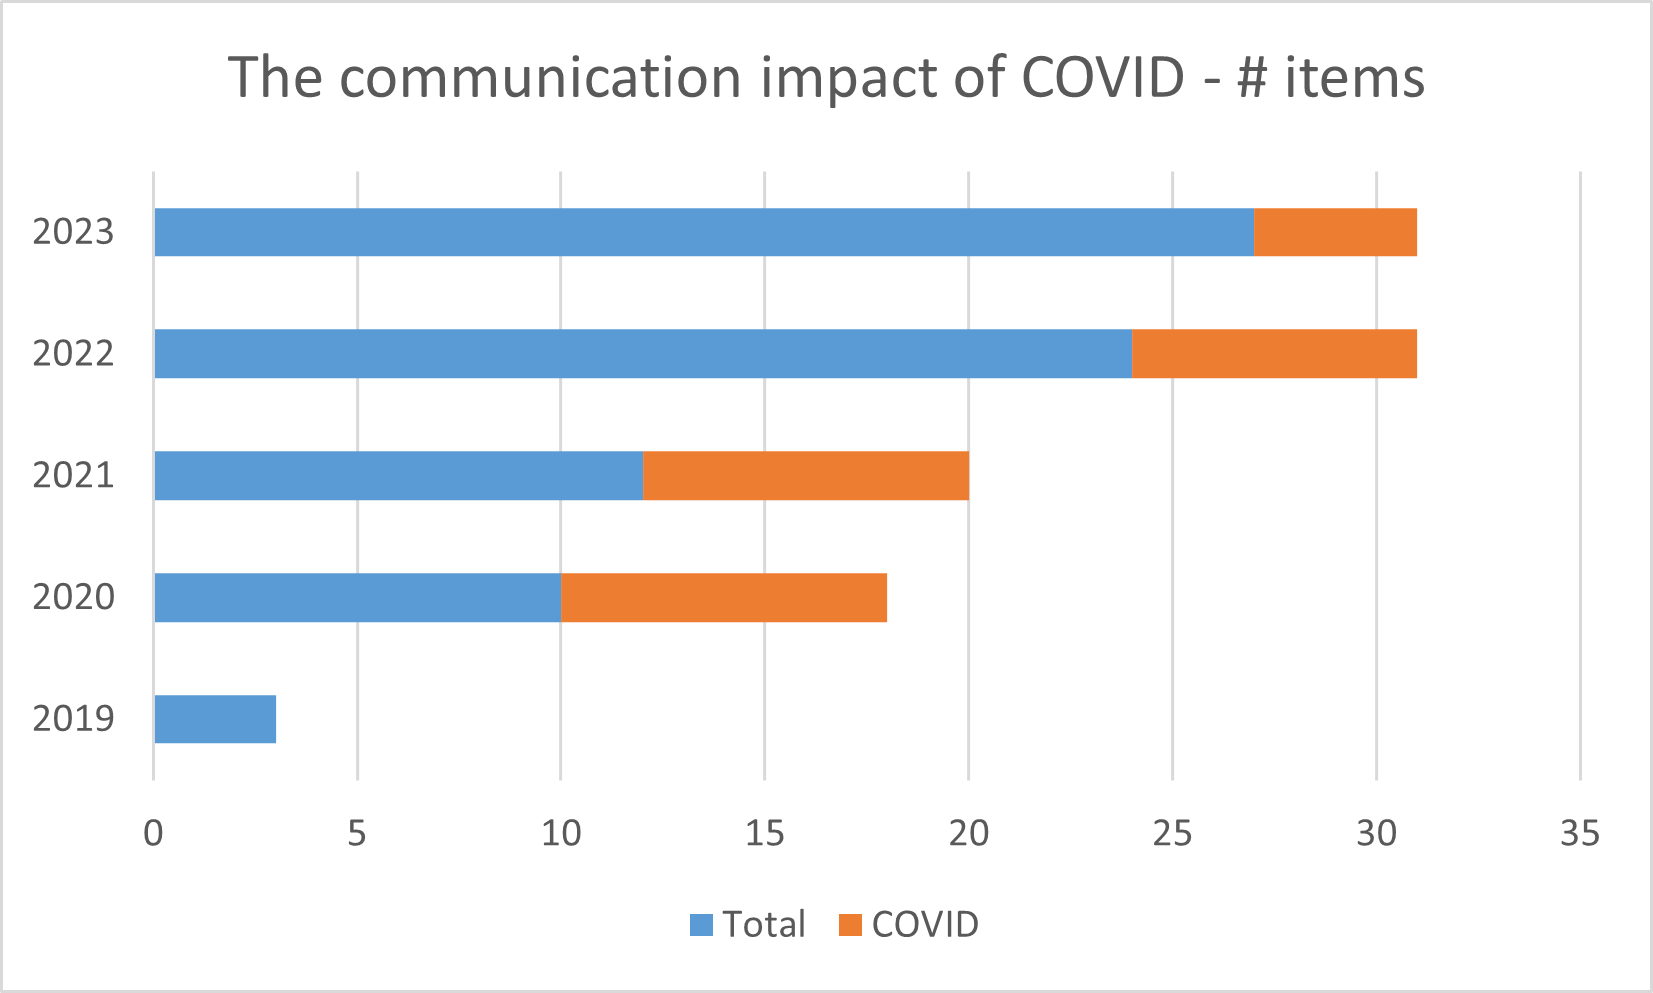
Let's just look at the how often "COVID" was part of the focus of individual items since 2019, in terms of "number of items total vs COVID and related":
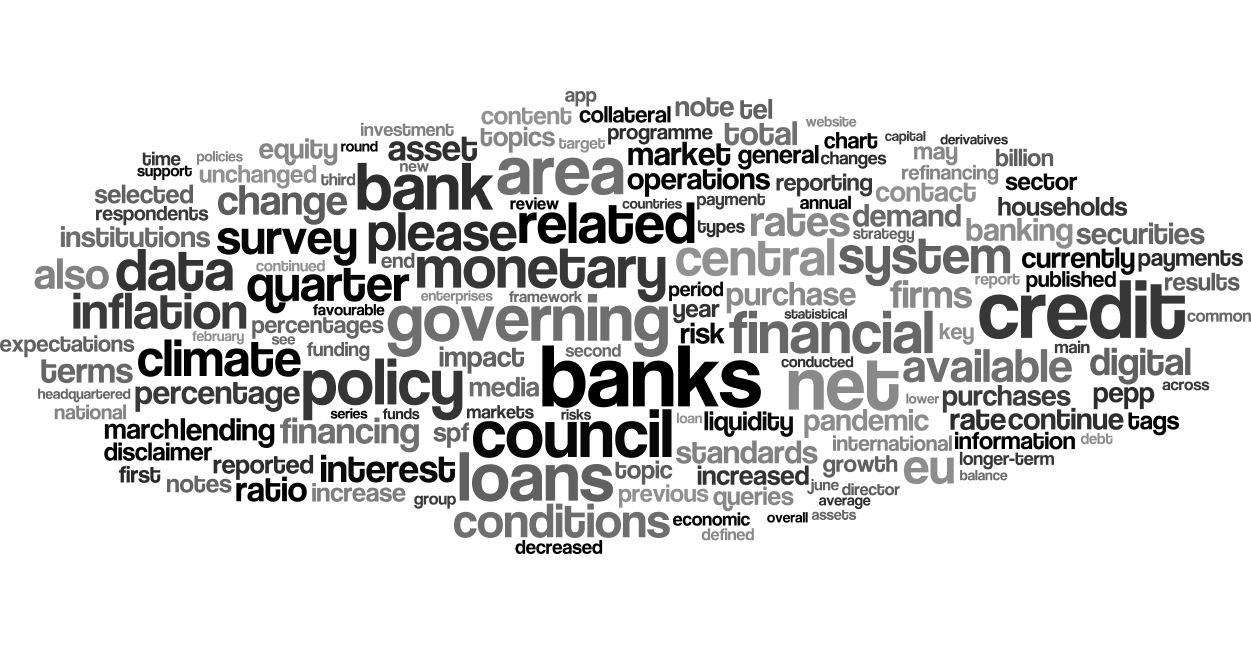
Going back to the overall communication (i.e. leaving inside also the most common keywords, such as ECB, European, and, of course, Euro, that had removed from the previous "tag clouds", to better highlight the evolution due to COVID):
This was 2019 at the ECB, a "macrolevel", but then, as I am based in Italy, in 2022 started looking via annual reports ho COVID impacted on businesses in Italy.
Looking at the business evolution in Italy since 2019 required first to look at a point of harmonization, and selected "transparency", i.e. readily availability of information.
Considering that the audience would be based abroad, I also selected those who had annual reports also (or exclusively) in English, but nonetheless were listed in Italy in both 2019 and 2021.
Also, a further point of harmonization was seeing if their data presentation was harmonized with a common presentation point that required shared "concepts"- and selected YahooFinance.
So, retained those who satisfied all those "transparency" and "harmonization" concepts, from the initial 500+ listed on Borsa Italiana went does to a 200+, and, after few more step and reconciling data for 2019 from annual reports with data within YahooFinance (to identify further areas of "creativity" in accounting or anyway need for further information not present in financial reports to reconcile), went down to 68 companies.
You would ask: each annual report may have hundreds of elements, isn't crazy to work on reconciling before you even know if the company will be retained in your sample for further study?
Well, the key is selecting "pivotal" element (a dozen, in my case) that "per se" allowed to both reconcile internally and vs. the "harmonization point" (YahooFinance).
Why did I skip 2020? Because the mere presence and absence of the annual reports for 2020 made it a non-comparable year- some companies basically ceased trading.
As shown also above within the ECB communication, 2021 was the first year that started showing signs of recovery.
This is a first step toward a more in-depth study (i.e. will move beyond that dozen of items, and will do further number crunching on those 68, before expanding again to see if the lessons or indicator learned apply also to others).
Aggregating data from 68 companies spread across different industries implies risking to add apples with pears: nice for a surrealist theatre piece, not for real number crunching.
Anyway, the aim here was to see evolution, i.e. how things changed in 2021 vs. 2019.
I used the industry and market classification provided by Borsa Italia for each company as was in 2022 when built the first list (the full list of companies).
Then, before digging further, asked myself: let's have a look at the inflation rate between those years, and consider therefore a range of plus of minus say 10% vs. the average change on each one of those dozen elements.
I considered the aggregate value in EUR, does not matter if positive elements (e.g. what companies received from customers) or negative elements (e.g. what companies paid to suppliers).
The idea was that "blue" meant 10% or more less than average change, "green" 10% or more increase vs. the average change, "white" within that +/- 10% range, "red" when 2021 was actually below 2019.
Before sharing some concepts, let's have a look at a visual summary.
First by market:
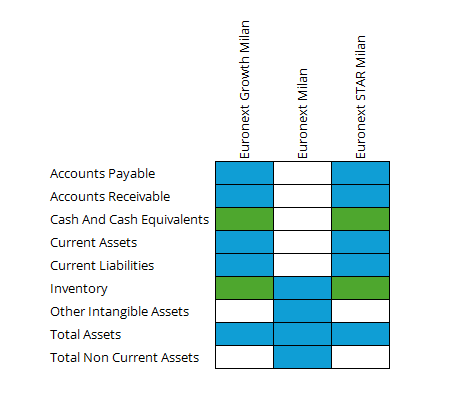
Then by industry:
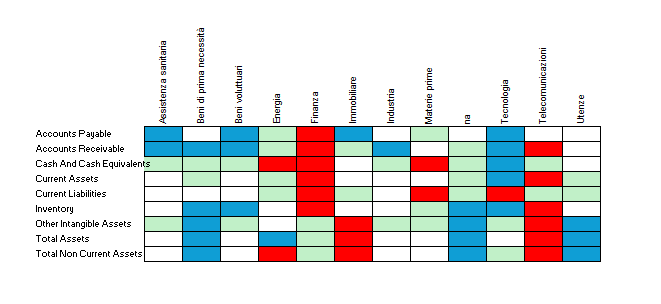
Beware: "industry" is the industry as per the Borsa Italiana website in 2022, hence many had "n/a", and some of the industry classification were not intuitive.
And, incidentally, as I wanted to focus on evolutions, while instead during the COVID crisis massive liquidity was injected within the economy, for this phase "finance" does not include bankassurance.
If you counted the items, you can see that are less than 12.
The reason is that I removed some elements where a single industry was off-the-chart, notably on real estate.
Because a first side-effect of the COVID "frozen year" (and its "slow thawing" that continues now) is the impact on property: with many companies shifting to remote working, as I shared in 2020 shops and offices e.g. in my birthplace of Turin simply shut down, or went on the market for a fraction of the price.
It will goes on, but implies also that those having liquidity available were able to pick up properties at prices that already in 2021 (and 2022) generated an increase in potential value.
It is expected to see changes to all of those elements, after two year, but some elements were still "feeling the blues" (recovering less dast).
Obviously, those two pictures are just to highlight few elements, while any further investigation will focus on more subtle nuances:
_ not just more items from annual reports
_ but also considering the lifecycle phase of each company, relative industry weight and trends, etc.
Numbers in future discussions will be able to consider also other elements that are currently difficult to extract from most annual reports.
As an example, few companies delivered "integrated reports" including financial and non-financial to a higher degree of details, so considered in this phase just the "financial side".
Anyway, from 2025-2026 will become more common and actually part of compliance the introduction of elements that consider also long-term sustainability, product lifecycle, and e.g. new reporting requirements such as those currently part of the first versions of IFRS S1/S2, and the business side of UN SDGs that inspired many ESG (Environmental, Social, Governance) reporting and monitoring initiatives.
All this information, along with further information across the supply chain will ease "clustering" analysis, by identifying and monitoring the evolution of classes of companies across industries, and also cross-industry.
As an example: while "by industry" makes sense when you talk of purely process-oriented product companies, already a dozen years ago a company such as Porsche stated in a public conference in Milan that they expected over 20% of their income to derive from something different from what you would associate with that company.
Increasingly, also cars will become platforms for services, and not too long ago some automotive companies in Germany and companies from telco and other industries announced joint initiatives e.g. to integrate technologies such as blockchain and payments within vehicles.
The next step of the analysis will be still focused on 2019 and 2021 for those 68 companies, extracting more data and associating with the relevant parts of the annual reports.
Anyway, with the increase in flexibility and power of automated number and text processing, probably in the future, when all the above sustainability and ESG (quantitative and qualitative side) will have been integrated into annual reporting, instead of current analysis done on few parameters, even market authorities could become able to process automatically annual reports to identify "clusters" worth further investigation.
My aim is limited to see how COVID affected companies, starting with those 68 and then expanding, but others might use the same data for other analysis activities over a different timeframe.
Hence, while gradually I moved down from 500+ to less than half (the real target), to the current 68 (the harmonized subsample used to develop models of analysis), I kept posting on Kaggle the evolutions of the dataset, and will, in the future, add more data there.
Eventually, I plan to publish more material on the result of the research.
This is just an introduction to a much longer story: those elements (and few more) were just "pivotal" to guide the selection of companies to follow.
How will this evolve? Well, keep an eye at this page.
Have a nice week-end!
Storytelling- the background
The pictures within that short story actually are based on data- relatively large amounts of data.
I outlined the context of the experiments, now few lines about the experiment itself.
If you skipped the previous sections- please stop and read them, as their concepts will be useful here.
The purpose of this experiment is to share a first layer of information, as if it were a presentation to an audience that is interested in change (notably digital and green transformation), but is not necessarily composed by people (or even "scraping bots") from a single, specific domain.
My business and number-crunching background includes multiple industries and cultures, as well as multiple technologies.
So, as discussed in the previous sections, decided to "create a context" to my research on how things evolved between 2019 and 2021 by storytelling.
I have been part of various related groups (from number crunching the past, to information theory, to visualization and presentation, etc) since the early 2000s, as it was a way to expand on what I had learned on the ground in the 1980s and 1990s, but post-COVID attended once in a while data storytelling meetups based in... New York.
Generally held after the end of the local business day- implying that is a late evening in Europe, but those presentations often were worth the wait.
How did I get there? As part of my updates on skills, looked for tools to use in presentation that were free and allowed "layering" on data.
The concept is that you can deliver a presentation across multiple layers of audiences, but each one acts as a gatekeeper to a more "to the point" audience that, depending of what are your purposes for delivering the presentation (proposing a business case, selling services, selling/advocating for the adoption of products or processes, etc).
In knowledge-based activities, this allowed to improve efficiency (increased number of potential contacts vetted) and efficacy (ensuring that those shown to be worth the investment in time and resources would be contacted by the appropriate people, while being consistent in terms of information).
Hence, already in the 1980s my concept (coming from prior political and Army activities) was to present to each audience a layer, then the next, etc- but the first presentation layer was built "bottom up", i.e. from details to outline.
Seems intuitive, but I still see routinely presentations that convert ideas into concepts but present them as if they were already applied.
The catch? If they push the right buttons (or find an audience gullible enough), those presenting can "score a point" (e.g. sign a contract).
The troubles start when then somebody has to convert those "paper tiger promises" into "operational commitments".
This specific experiment (and the further evolutions that will follow) is all about storytelling, but blending, through data, two worlds: the EU level of finance (through ECB view on reality in 2019 and 2021), and the Italian business evolutions (through what data within financial reports say).
Another point that this experiment shows is how a "tool within the toolset" (that now weekly updated on ECB communication started in 2019) can actually become a building brick in various activities (in this case, the specific pre- and post-COVID).
I do not know how familiar you are with annual reports- but there is a significant (and variable) laundry list of items that eventually produce the profit or loss.
As my purpose was to identify and discuss evolution, I selected just 12 items (will explain the rational of each item and its selection in a future publication) as "pivotal elements".
The key reason? Reconciling on those 12 allows, if needed, to further expand to other elements presented within annual reports, and, by combining them, to derive "Key Performance Indicators" that allow to monitor evolution.
Also, some of those elements act as "boundaries" to reconcile sums of details etc.
As for the ECB, used from my database first built in 2019 but where added all the elements available since 1997 (I still have to complete 2003-2017 press releases, as before focused just on those from 1997 until 2003, i.e. one year after the release of the Euro, plus 2020 to present, i.e. the "COVID and post-COVID era").
Elements used for this article, for 2019 and 2021:
_ all the speeches
_ all the interviews
_ all the ECB blog posts
_ all the ECB Podcasts.
The ECB Podcast items (which will be used in future publications along with the other material) from 2019 have been mainly explanatory elements, including eventually an explanatory podcast whenever specific decisions are set that require to reach out beyond professionals to "share the message"/"highlight where we stand" (e.g. on digital euro).
I did not use press releases (also if I had collected until recently 1997-2004, and from March 2020 until today, but currently contains 1997-2008 and 2018-current).
The database that is shared also as a dataset on my Kaggle profile that contains only word frequencies, to both make a faster search and smaller online database possible.
Now, a closing section about further investigations and some suggested reading material.
Further investigations
You can have different examples of self-contained narratives and their development within e.g. these three articles:
_ A different model of #Italy - using #NextGenerationEU, #COVID, #PNRR as #leverage
_ Accelerating European Union rights integration: from directive- to regulation-based harmonization (with cameos since 1990s)
_ Change Vs Tinkering - evolving data centric project, program, portfolio frameworks.
Actually, sometimes the narrative can be quite extensive- as I did for short stories for friends, or as "concept presentation" for projects, explaining in a "journey" mode where we started, and where we could end if the customers awarded us the project.
While living in Brussels, before projects that required to present a concept, for copyright purposes uploaded and registered my documents on WGA (The Writer's Guild of America) website, were at the time there was a service to "host" your document certifying date of deposit, and keeping that for a couple of years (or more if you repaid the fee)- to keep the identification of the originator.
To utter that I was "protecting" is a too large a concept: unless you have the resources (and maybe structure- i.e. a team) to give teeth to your right, it is a long shot- and, anyway, would absorb your time, subtracting it from more interesting activities (including your own life).
Incidentallly: the WGA website used to have something equally interesting- pro-forma contracts for a range of activities involved within the entertainment industry, including something that could be useful for game and software designers.
Generally, I associated the "summary concept outline" with a document few pages long, roughly equivalent to a "treatment" for a potential script.
An even more different type of narrative is building a journey through a fictional case, but, in my view, also a training course.
The latter anyway should be structured not just as the usual "talking-head-reading-slides", but more as an interactive performance involving both those delivering and the audience, following a roadmap but generating a using transformative experience- as a team, and for each participant.
Actually, after delivering training, be it on processes, technologies, organizational changes, etc, I used what I had developed in my first presentations, first in political activities and then delivering in the Army a training that I had designed (the latter mid-1980s).
After each lesson, I did a quick "ex-post assessment" to influence the delivery of future sessions.
Too much to visualize? Well, you can actually read both a 200+ pages fictional case (2015-2018) and three courses that prepared following that approach, focused on "soft skills" in 1990 (unfortunately, in Italian- but it is the structure that matters, and I think that you can quickly derive your own concepts).
All that material is available on a permanent website that I had created to store material from "pilot projects" and project outlines for my future extended (i.e. real- the 2-pages one you can find online is a summary) CV.
It is all available for free- and you can reuse/recycle if and when needed, no license is really needed; anyway, would appreciate if you were to include in your own material the link to that website, so that others can either reuse the source (yes, my own variation of CC-BY-SA, see online the explanation- was introduced to Creative Commons by Joichi Ito in Milan almost 20 years ago, as we met at the IBTS in Milan, where I was the in support of a startup whose business and marketing plan I had developed).
If you are interesting in storytelling per se, I would suggest:
_ Syd Field's website (read his book in the 1990s for my activities on change, to expand and structure the "narrative" side)
_ Frances Yates "Art of Memory", specifically where she discussed Quintilian and his approach to using a memorable narrative as a memory tool- as this is actually something that, if embedded in you presentations in person (or via video conference) often increases memory-retention for those attending
_ last but not least, Whitfield/Roddenberry "The Making of Star Trek", specifically the part where they described how was developed a kind of "narrative reference" that enabled multiple writers to be aligned to the culture of the show, also if working in parallel, and minimize reworking.
Next week will release the first "episode" of the series on the European Parliament elections, with a narrative concept (and structure) that will be described within that first article- and will continue across the whole series.
Stay tuned!