 _
_Viewed 7409 times | words: 3605
Published on 2023-11-03 23:50:00 | words: 3605
Today is Friday, and therefore should include some levity within the article, honoring the old TGIF motto that my American friends (but also many British friends) shared with me decades ago.
Actually... with a British connection, we often ended up at a specific TGIF restaurant in London and dined while sipping a concoction that he taught to the bar tender, a concoction involving orange peel, lemonade, and Jack Daniels (that he had learned, say, straight from the horse's mouth).
And our chit-chat was closer to the content of this article (and the underlying project) than to anything else.
So, as the article that I had planned for today and announced yesterday on Linkedin (while informing about an update to the dataset built on data from the website of Borsa Italiana) is anything but heading into that "it's Friday" direction...
... I shifted that "get ready for the week-end" part to Facebook, by sharing some notes and links from a book of cartoons from the XIX century about somebody from the mountains of Piedmont who actually during the first phase after the unification of Italy, first in Florence, then in Rome, worked toward what was as elusive then as it is now in Italy: balancing the State books.
The book review on FB/LibraryThing is here.
And now, let's get back to data.
The dataset is here, while the associated Jupyter Notebook with some basic visualizations (tables, pie charts, in future others) is here, and will be evolved continuously (as all the other datasets and related webapps or Jupyter Notebooks that posted online since 2019).
This short article is within the CitizenAudit series, and therefore is both a recap and a presentation of the current status, and contains few sections:
_ recap- a short history of the dataset and data project
_ the evolving dataset and its latest add-on
_ presenting data- accessing through the portal
_ presenting data- accessing company annual reports
_ next step in this project
As happened for other analyses, reports, datasets, etc in the past, eventually will share a mini-book summarizing end-to-end, and focusing just on the end choice for each step, to ease replicability to other environments or countries.
If it were to be instead something written for a customer (or for my own knowledge retention), would of course include also the twists-and-turns, as well as dead-ends that you have in any exploratory data project, but...
Recap- a short history of the dataset and data project
On my CV page listed as key industries I worked on the following:
Sample experiences by industry (1986-2022)
for longer-running customers (3 years or more, the years are listed)
- Automotive/Mobility 1986-2022 (key customers)
- CNH/Iveco 1999-2001/2012/2015-2018/2021-2022, SKF, FIAT 1986/2002, Magneti Marelli group management reporting 1988
- Banking 1988-2007 (selection)
- Arcafondi 2004-2007, Cedacri 1990-2006, Banco Santander Finconsumo 2004-2007, Credit Suisse Private Banking, Credit Suisse, Crédit Agricole du Var,UK-based risk/ALM software companies, Federazione Toscana Casse Rurali ed Artigiane, Sanpaolo Invest, Sanpaolo
- Software BI, DSS, Management reporting, Banking, Others between 1991-2004 (selection)
- Brio, MIP, Applix, Retek, TM/1, Comshare/Arbor; support to other UK-based
- Gas/Logistics
- Sappi, DHL, Novogas/Liquigas 1992-1997 (1991 on another customer, same CFO), Intertransport, SAV; see also "Retail"
- Government
- Sviluppo Italia 2004-2006, Ministero dell'Interno 2004-2006, office work within the Italian Army
- Retail
- Filasport 2001-2003, EPA/Coop, Carrefour, Retek, Comshare, CEDIS Migliarini, GS, Autogrill
- Start-ups, 1998-2010
- Watchbook/kanshu, TOHF, TheCruize, Teknemedia, others; support mainly in B F IT UK USA
- Consulting
- Sys-Tek 2004-2007, Reply (various business units, prospect validation 1997-2001, customers as part-time PM/BA 2002 and 2004-2006), Client Focus 1990s; CGI 1990-1992; Andersen/Coritel 1986-1990
- Non-profit
- Trees of Hope (USA/Rwanda) 2008-2010 and support to start-ups 1990-2011 in Italy, UK, USA
This project started just with a doubt derived from an obvious observation also if you never worked in cultural and organizational change for few decades: the impact of COVID restrictions on supply chains and work organization, considering that no country is an island, but measures were still adopted on a country-by-country basis.
Courtesy of lockdowns, companies actually adopted a more transparent approach to discussion, while searching for solutions, as they acknowledged that only a convergence of interests (and associated bartering) could quickly deliver results.
As shared in past articles, this involved renegotiating contracts with their "Tier-1" suppliers, i.e. exposing how their suppliers used their own suppliers upstream to deliver what the final (corporate) customer wanted.
The aim? To understand where risk and weaknesses were along the supply chain.
And this included free webinars that discussed those points, shared lessons learned, and even work-in-progress.
At the same time, I was updating my skills on the data side, shifting by choice to "open source"-only, notably on AI and related.
To summarize something for me coming from security: nobody has the resources to really ensure that your algorithm is safe, hence focus on the keys, but expose the algorithm so that other can find its flaws.
And I am not the only one, as actually people much more important than me in that field keep advocating open sourcing.
Personally, I would also like to see more open data and open sourcing of the training datasets, to allow external scrutiny to de-bias data.
In Italy, there are really few companies listed on stock exchanges (in Italy or elsewhere).
Hence, by selecting as a datasource companies listed in Milan, and specifically those listed in Milan but whose main stock listing market is Italy (i.e. stock identification number starting by IT), and adding further restrictions (basically, on transparency- see the description of the dataset on Kaggle), my collection of annual reports for the year ending 2019 and year ending 2021 is not necessarily representative of the whole of the Italian economy.
Anyway, as I wanted to enhance reproducibility by others, I selected an open datasource and data that anybody can access without the need of a registration (in some cases even companies listed on the stock market added further restrictions to data access, or even removed past data).
Also, the expectation is that annual reports subject to the scrutiny a company listed on the stock exchange is bound to receive would...
... show less of the traditional Italian creativity when it comes to business numbers.
After starting in fall 2022 to collect the data, completed the list in November 2022, and then started adding updates only on those that were already within the list.
Hence, if a company meanwhile fulfilled the conditions to be within the list (as provided annual reports for 2019 and 2021 despite being listed from December 2022), but was not in the original list, it is not within the original list.
Likewise, if a company lost since creating the list the conditions (delisted, merged, etc) to be within it, as the information was at the time of collection and ensuing updates available, is still within the list.
The dataset itself has documentation of the various selection phases, with additional columns stating which case is represented by each company within the list.
The evolving dataset and its latest add-on
When first visited the website of Borsa Italiana, looked also at the indexes by industry, and then looked at the companies classified under the taxonomy provided within each industry.
In reality, saw that industry lists covered only part of those listed on the stock exchange (this was expected), but also found that some companies were not classified as I had expected.
This reminded me of my first business experience with the USA Standard Industrial Classification (SIC) and related, which was in the late 1980s.
Reason? The business unit I worked for, at the time called Andersen Software and associated with Arthur Andersen Management Information Consulting Division, was focused on selling packaged software resulting from projects turned into products, but specifically my subunit was instead focused on selling packaged software produced by an Anglo-American company called Comshare, Decisions Support Systems and Executive Information Systems.
Incidentally, that later became Andersen Consulting, and, post-spin-off and before Enron, became Accenture, as could not use the "Andersen" brand.
As far as I remember from the design contest which selected the name and initial logo, Accenture was supposed by the proposer to stand for AC-century, i.e. Andersen Consulting Century, shortened into Accenture.
My bit was specifically the PC-side of DSS (eventually called One-Up while I was there, then renamed Commander PRISM in the 1990s, when I worked on it for the CFO/COO of a company).
Beside the already large potential pool of customers (Andersen's- Chinese walls were back then Japanese walls, pre-SOX- e.g. for a time at San Paolo Bank on General Ledger I was on the software release side, while Arthur Andersen's auditors were on the auditing side and had a room near them during delivery), there were additional customers brought from prior Comshare presence in Italy, as the sales and prospecting side was joint AndersenSoftware-Comshare (the Comshare side was always composed of non-Italians), but Comshare had already had before another partner in Italy.
So, as it happened few times in the past activities there on other issues, a bureaucratic barrel in English started rolling down- until went to the last one on the food chain- me.
Therefore, I received a nice list of industry classification codes, plus a procedural description of how to create a new customer code (the code was actually provided by another office, but had to fill the classification information) and... had to fill in the documentation to add Alitalia.
If you bother to ask... yes, I still remember some of my customer codes, and at the time made up a rule, as we were supposed to report every two weeks by the hour, but instead I had many customers and accounts to work on...
... to report by quarter of hour- which is convenient, as it implied that I could report .25, .5, .75, or 1 hour: and, as I had too many lines, sometimes had to use two forms for a single fortnight.
Years later, saw that had become normal for others too.
My prize for that bureaucratic bit? The first activity there was actually on a Saturday in Rome at their Magliana offices, to have a look at a model that had been build for a multi-vendor "hands-on context" for marketing.
It was a funny coincidence that, a decade later in another country, this time for Brio, in a completely different industry, was to be in a similar concept project my more technical colleagues from Paris and Palo Alto, i.e. working on a "comparative hands-on assessment".
It was anyway useful and interesting to learn how other countries classified companies, something that then in 1990, when I registered my first VAT in Italy, was able to compare with what was done in Italy, and, years later, was able to compare evolution in 1993 in Italy, 1998 in UK, 2018 and 2023 in Italy (plus from the early 1990s to late 2010s for my customers and employers in multinational environments in Italy and abroad, including for banking risk management, comparing how industry affected assessment).
As it happens with the classification and decomposition of the "bucket" (in Italian "paniere") of goods and services used to compute the Consumer Price Index in Italy, a taxonomy is representative of the culture that defines it, albeit in Italy the European Union impact (e.g. Eurostat, the European statistics bureau), and other alphabet soup non-governmental entities (say- OECD, WTO, etc) over the years had an increasing impact on convergence.
Still, some "local" elements remain.
Earlier in 2023 spent time to design KPIs and models, and sampling annual reports, and completed that "collection and collation" by September 2023, when I last updated the dataset, to mark which companies would be part of the study.
Then, revised KPIs and tried to identify data pipelines and workflows: hèlas, as the number crunching side to compare will require to reuse my old business number crunching and internal auditing / financial controlling skills to "normalize" figures by reading the actual notes describing e.g. what goes within the "cash and cash equivalents", that will require more time that then first phase, on communication before and after COVID.
An example: if you read in a report "cash and cash equivalents", you would assume that "equivalents" implies as accessible as cash.
Anyway, if you include there also short-term deposits (e.g. see here a definition) held at the institution where you get in turn e.g. credit, in my view that is not exactly "cash equivalent", as there are direct (defined by the product) and indirect (e.g. for example if those short-term deposits then are collateral for credit) elements that could affect the company's ability to treat that supposedly cash equivalent as cash would be treated.
Why would you do that, if you were a company? There are many operational and financial as well as risk management reasons, but will let you look elsewhere about the reasons, legitimate uses, and past questionable uses.
My latest update to the dataset done yesterday was then to simply allocate all the companies within the scope of the study (i.e. those confirmed in September 2023) to the taxonomy provided by Borsa Italiana.
How did I do that? Simply- used the lists provided by the website of Borsa Italiana.
Implying: I did not apply a process to classify, simply picked up the lists (I saved copies, again for reproducibility), and cross-checked if each of the companies listed was within my selection.
For the sake of completeness and again reproducibility, the dataset anyway contains two columns "industry" and "subindustry" for any company (also those outside my scope) who were within the relevant list provided by Borsa Italiana.
Added bonus: if somebody wants to use my list to adopt another scope, all the information (URLs, status of what is available and what is not, industry and subindustry classification) is there- and can e.g. focus research on all the companies that on the Borsa Italiana lists were classified as belonging to a specific industry- also if excluded from my own selection.
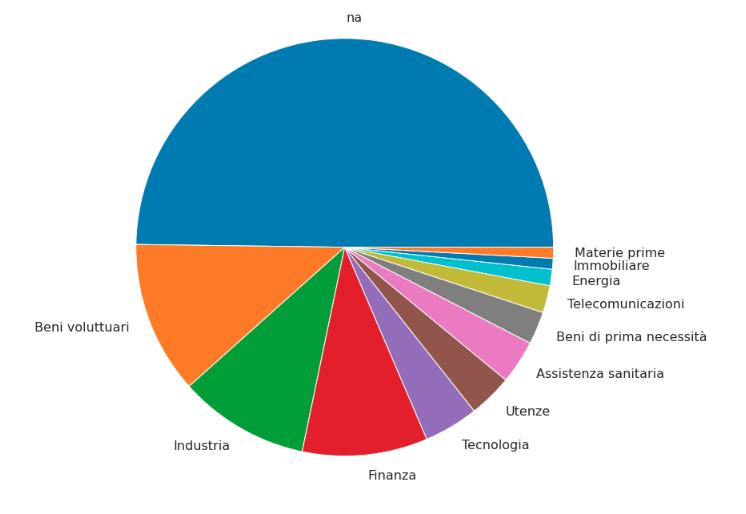
As you can see from the Jupyter Notebook associated with the dataset, the net result is the following:
118 - na (i.e. no industry listed)
_28 - Beni voluttuari
_24 - Industria
_23 - Finanza
_10 - Tecnologia
__8 - Assistenza sanitaria
__8 - Utenze
__6 - Beni di prima necessità
__5 - Telecomunicazioni
__3 - Energia
__2 - Immobiliare
__2 - Materie prime
I said that selected the companies by looking at a set of criteria, criteria outlined within the description of the dataset on Kaggle, but would like in the next short section briefly to describe which data you can find where, using the information provided within the dataset.
Presenting data- accessing through the portal
Initially, I had expected to find on the Borsa Italiana website something similar to what you can find on Edgar for the SEC.
Therefore, while researching data, in summer 2022 followed also some project-based training on Google Finance and Yahoo Finance on Coursera, i.e. mini-courses where you actually use either Google Sheets or Microsoft Excel to retrieve data about a specific "ticker".
Which really reminded me a bit of the Comshare Executive Information System, which allowed to connect to a datafeed with live ticker tape, CNN-style (in the late 1980s), plus to add a touchscreen... for the sum I think of 3,000 GBP for a 15in monitor.
Shifting to reality, I saw that the data feeds available on the public website of Borsa Italiana are of a different structure and nature.
The dataset contains columns with URL links- for companies within the selection, there are both links to the listing on the Borsa Italiana website (a kind of "card", in some cases including also financials), and, if and when available, also an Acrobat file, plus links to the actual page on each company website that was provided on the Borsa Italiana website as link to an "investors relations" page.
In some cases the link actually lands on the homepage of the company- or even on the e-commerce of the company, in others to a specific subsection where all the information that the company selected to present to potential investors.
Actually, also when the link points to an investors relations page, and when that page contains a recap of financials, the explanation of "why" and "how" each figure was composed is not available there: you have to read the annual reports and associated commentary.
Hence, again I retained the links, but will keep a copy of the data just for reference, extracting both the commentary and KPIs from the annual reports.
Presenting data- accessing company annual reports
As I listed above, I worked in multiple industries- interestingly, both in the late 1980s and all across the 1990s and up to late 2000s and early 2010s, I kept doing that.
Hence, whenever worked on business number crunching in a specific industry, learned also the conceptual differences in other industries.
Differences might range from the different distribution across the year of sales, to your own prices and sales speed of alignment with changes within the business context- in some cases, changes occur immediately, while in others you do not see immediate change.
Ditto for reverting changes: in some cases the restoration of prior patterns is immediate, in others, notably when you do not have control on the factors influencing the conditions, what you do does not impact directly, or might even negatively impact.
Look at what happened with the increases of tax rates: how much did ECB choices really matter on inflation rate, when it was mostly imported? And how much instead those rate increases that did not directly impact were the "seed" that generate the contraction in growth across the EU?
Annual reports and associated commentary include not just operational results, but also the rationale that, according to management and auditors, generated those results.
And will add more commentary on these lines after will have data to share.
So, what's next?
Next step in this project
Within the next publication steps, will actually share something more, but focused, as I wrote above, on my more limited target: comparing 2019 to 2021 (also if retrieved annual reports 2018 to the latest available).
While doing that reporting, will also identify pointers that might be useful, on the same data, for others having a different project scope.
If and when feasible, will share that information as well.
The key idea now is to start by the concept of communication 2019 vs. 2021 overall and by industry.
I will follow a relevance pattern, i.e. start with those I worked more in, and also those most representative within the selection, and then expand on that.
The tools? First will start with the usual tables, tag clouds, and KPIs, then will share something more related to the meaning expressed within the commentary associated with annual reports.
The timeline? Starting with November 2023, and continuing until June 2024, as by July 2024 there should be another major round of releases of annual reports in Italy.
The purpose? To use the KPIs and other material derived from my project within further publications.
I will anyway keep up-to-date the dataset posted online and linked above, by adding any further classification/clustering/indicator information that will be derived from my number crunching and AI-model building activities.
Stay tuned!