 _
_Viewed 17299 times | words: 3822
Published on 2023-10-10 22:20:00 | words: 3822
This article is within the CitizenAudit section, and therefore is focused on number crunching with a systemic perspective.
Or: looking at data, sharing data, sharing minimal commentary yet separated from data and data sources.
Aim, as other articles in this series: be useful as "background preparation" for my own further scribblings, while also sharing data, sources, concepts that might inspire others (even generating dissent is a form of inspiration).
The sections in this article:
_ prologue: the context
_ the larger picture (recap)
_ Turin as seen from the data
_ Conclusions / my preliminary take on data
As you can see from the word count, this article is longer than others within the CitizenAudit section- the conclusions are actually an article with my considerations.
Consider it a kind of "disclosure" on what I think about the data, and potential conflicts of interest.
Anyway, again as common in this section, I selected many charts from reports etc that actually could require more of your time than the actual reading.
For this article, did not create new charts: selected some from other sources that already used in previous articles, and new ones from additional sources, listed in the next section.
For historical reference, as past documents are not available anymore online, downloaded both documents on 2023-10-09 and 2023-10-10:
_ the document from Turin
_ the document from ISTAT.
Obviously, each chart is referenced to the source.
Prologue: the context
It actually dovetails with articles that posted before:
_ A systemic journey toward TechWeek2023 in Turin: 4 of 4 - connecting the dots
_ Emergencies or emergence? Trends are a matter of choice #EU #Italy #industrial #policy.
While first one includes material and feed-back from the TechWeek 2023 held in Turin Sep 27th - Sep 30, and was within the section on "Society: EU-Italy-Turin", the second contains material from population trends analyses released by various sources- including Eurostat, and was within the section "Business: rethinking".
Whenever sharing data, I think that there are at least three elements to consider:
_ if your aim is to communicate, or to share analysis
_ if your audience prefers the former or the latter
_ how you want to position yourself: motivator/facilitator/wannabe opinion leader or analyst/expert/digested data source?
If you want just to communicate, you can probably just read an article or a book on a subject you want to share your opinion about.
And, actually, from the quality of material, I must say that it is not unusual to read "analysis" that is actually "communication"- also embedded into laws or working papers.
If you want to share analysis, you need to have a knowledge of the domain somewhat deeper than what you communicate.
Actually many years ago, developed an approach on that line that was useful since the late 1980s to actually have somebody do the "first level of response", and then escalate as needed after filtering, but without having the first line (who could actually be senior management facing prospects and customers) something that had to be disowned by others taking over.
A part of that concept is explained within the only book that published in Italian "Strumenti", that you can read for free at a serialization in articles on this website.
Beware: also if it refers to social media, it is a decade old- therefore, the concepts (as refers to role and information) are still valid, and on purpose did not contain "technicalities", but still some elements could not be relevant anymore- or just common wisdom that requires no reading.
The larger picture (recap)
Nothing new, in this really short section: just few pointers-via-pictures.
I shared in the past, and will share in the future, material focused on the wider picture, e.g. EU, but for this article, beside the recap of some key data that shared in the "Emergencies" article, would like to focus on Turin, using demographic data released by the town of Turin on its own website, covering 2021, plus data from ISTAT (the Italian National Statistics Bureau) on the same theme, covering 2019-2080 (actually the range depends on the specific table- will be shown in each picture).
You can read here the previous article where I discussed these pictures.
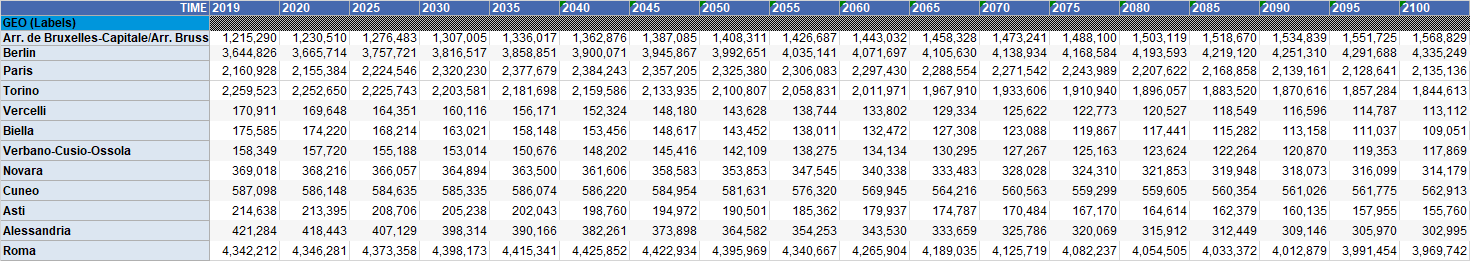
If considering the overall region of Turin was in 2020 2,253,000, and expected to become 1,845,000 by 2100, i.e. a significant projected reduction.
This table shows the trends by county/region, comparing Brussels, Berlin, Paris, Rome, plus all the provincial areas in Piedmont (where the Metropolitan Area of Turin is located).
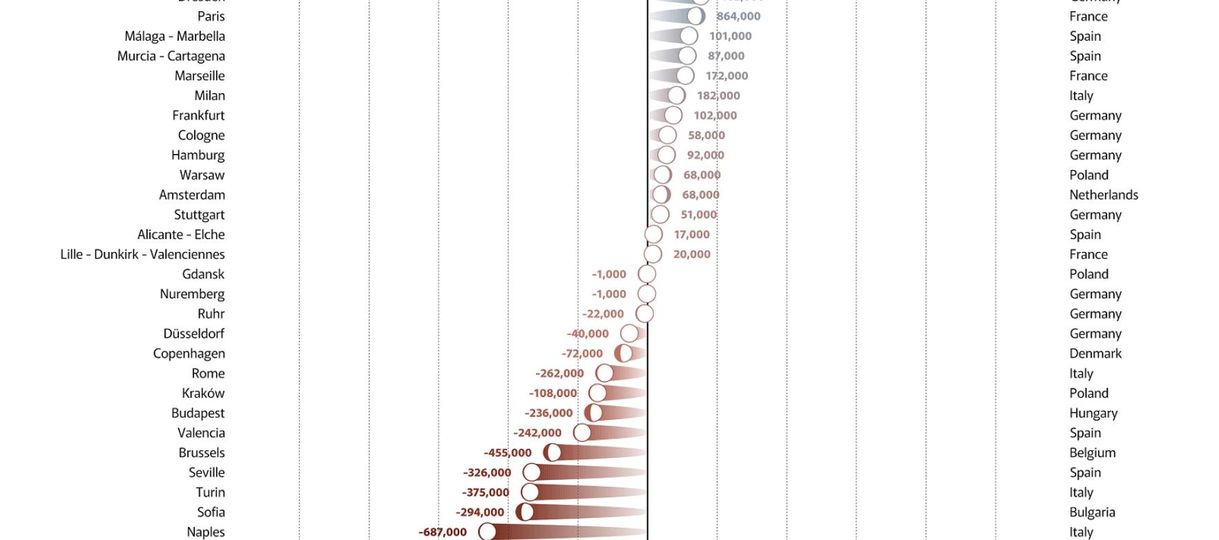
Major projected trend by metropolitan area
Specifically for towns (as metropolitan areas), Turin -375k in this chart
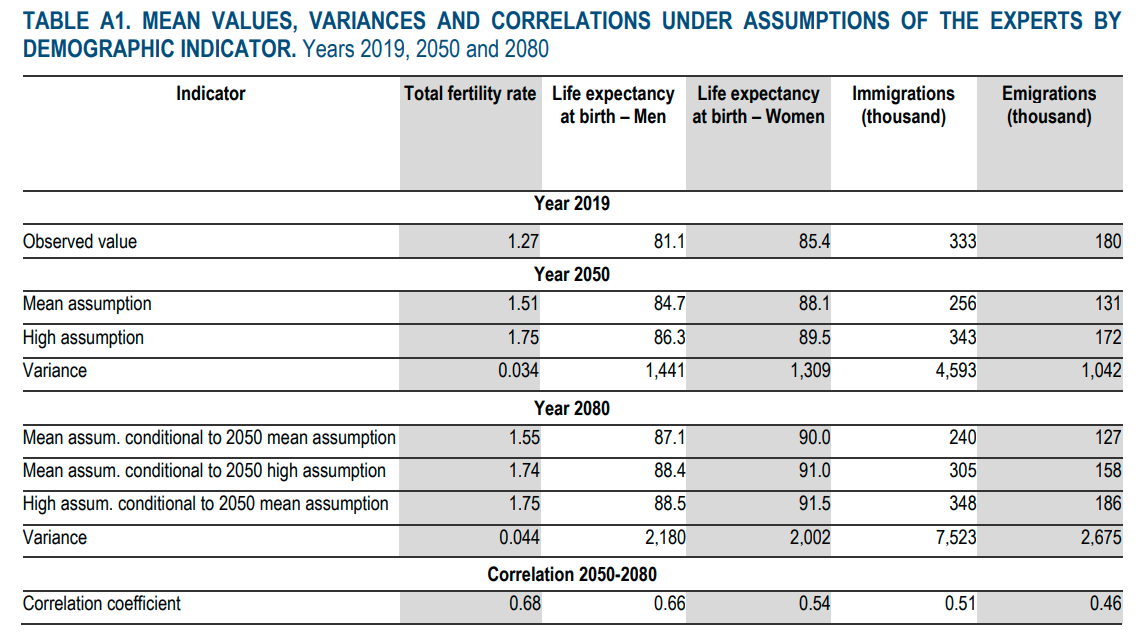
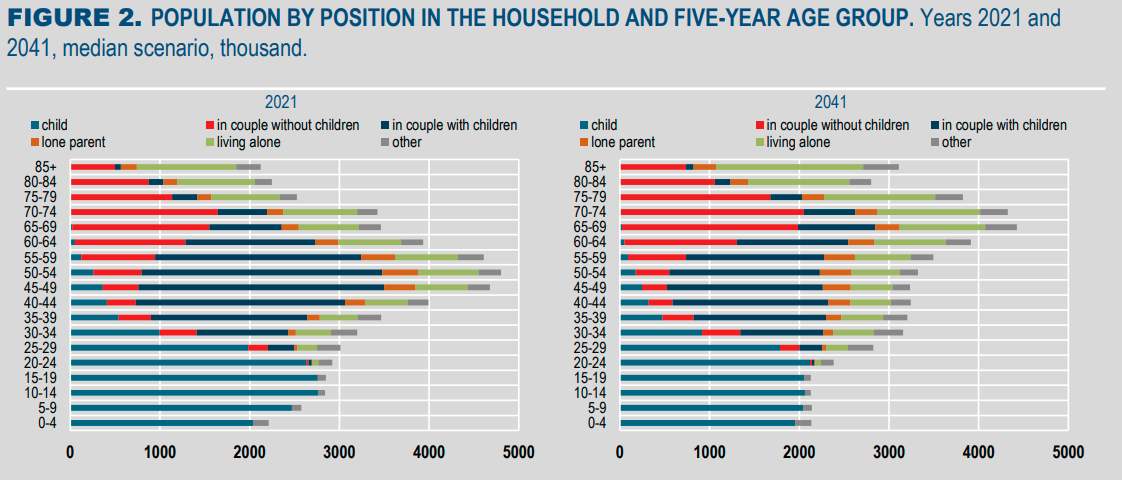
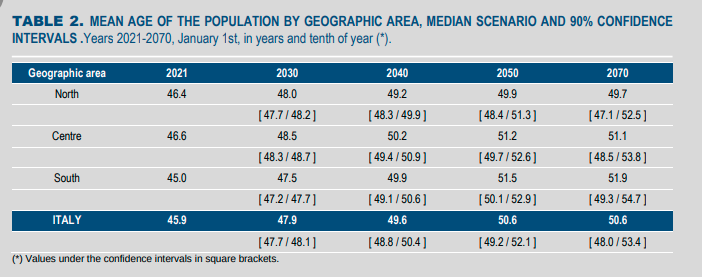
Few self-explanetory additional pictures about Italy in the future, from a report published one year ago by ISTAT (the one whose copy linked in a previous section- just in case it disappears online; anyway, in this link instead the original source).
Turin as seen from the data
This section is a journey through pictures, i.e. a data narrative.
As any data narrative, it has a start.
In this case, the journey started on January 2nd, as a twisted New Year Eve gift, shaped as an article published by the local newspaper La Stampa.
In Italian:
"
Torino si restringe: Perdiamo 4.000 residenti ogni anno
L'assessore Tresso: 'Così abbiamo meno entrate e si alzano i costi per la manutenzione di strade e verde'
Oggi a Torino vivono 858. 972 persone. È una città che si svuota e si restringe progressivamente, quella fotografata dall'Archivio anagrafico del Comune: il numero di abitanti cala considerevolmente se confrontato a undici anni fa, quando sotto la Mole si contavano quasi 48 mila persone in più. Significa aver perso oltre 4 mila abitanti all'anno. Un andamento demografico che si conferma, nonostante l'uscita dalla pandemia abbia fatto registrare di nuovo un lieve aumento degli stranieri. L�età media rimane sempre alta e si attesta sui 47 anni, con una persona su quattro ultrasessantacinquenne. Sono queste le statistiche con cui si apre il 2023 e con cui bisognerà fare i conti, anche e soprattutto nella scelta delle politiche sociali e urbanistiche da compiere da qui ai prossimi anni.
"Il restringimento della popolazione incide sulle casse comunali - commenta l'assessore ai Servizi Demografici, Francesco Tresso - Siamo dimagriti ma il vestito, vale a dire le strade e il verde da manutenere, è rimasto una taglia XL, senza però avere i proventi di quasi 50 mila cittadini in termini di addizionale Irpef, Tari e altri oneri fiscali".
Oggi il 70% degli studenti del Politecnico, dopo aver investito 4-5 anni di vita in città, decide di spostarsi altrove "
(from La Stampa, published on 2023-01-02 at this link)
Yes, it took "few" years (a decade, since I started again working and living in Turin in late February 2012), but at last official sources said that:
_ Turin is losing population- the article talks about 4,000 a year
_ this affects the feasibility of delivering basic services as road and garden maintenance
_ the key issue is that, as member of the current administration say, that the town is size XL, while the population "slimmed down" by 50,000
_ and also the local Politecnico is able to help retain on the territory just 30% of its graduates.
But this, as did in a previous article, is enough for communication, not for analysis.
Hence, let's dig a bit within the data provided by Turin, data which cover up to 2021 (I linked in a previous section the copy I saved, just in case the original goes offline).
The first obvious question is: what was the trend of the town (not the Metropolitan Area, that covers the whole county/"provincia" of Turin)?
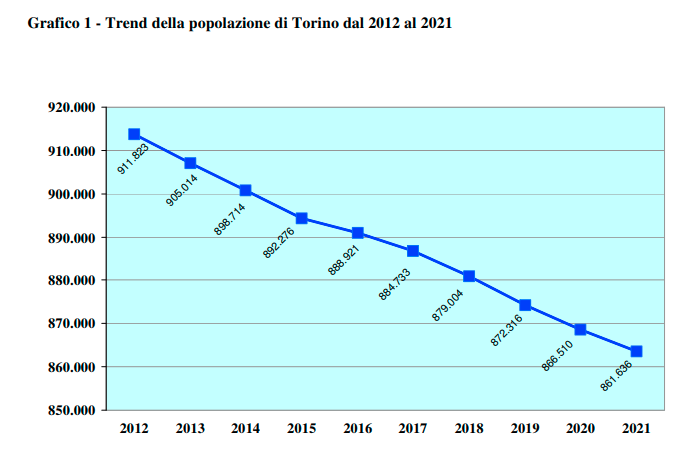
If you prefer a table version:
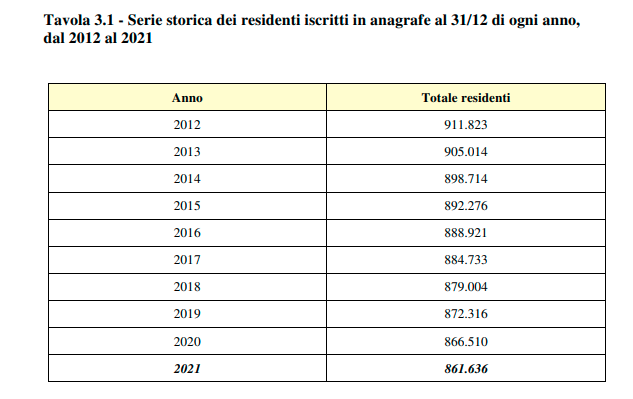
Quite steep a curve, and heading just in one direction.
Anyway, the article above talked about losing 4,000 each year. What do the data show?
More important, what does contribute to this trend?
There is a long list of tables within the report, that slices and dices data across different dimensions, e.g. distribution of population by age, sex, origins, across the various partitions of Turin, called "circoscrizioni".
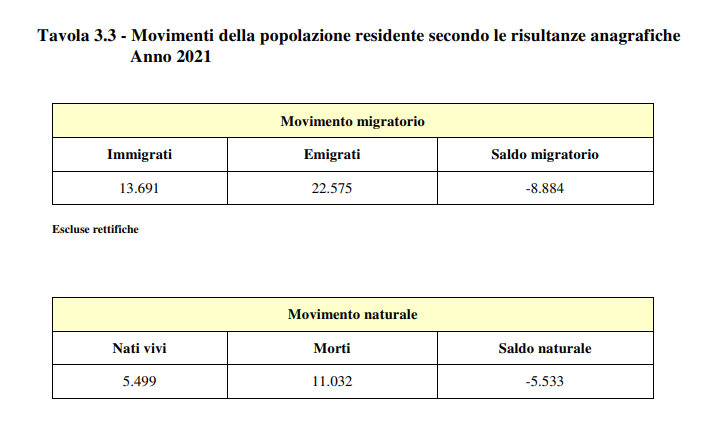
Anyway, a key set of figures is the numer of births and deaths per 1000 inhabitants:
_ Birth rate: 6
_ Death rate: 13
Or: over two deaths for each birth- and, as shown by other reports, in Italy it is a trend not unique to Turin- so much that just earlier this week was announced that Italy will lose a further one million citizens by 2030- this was the situation according to Worldometer projections on 2023-10-10
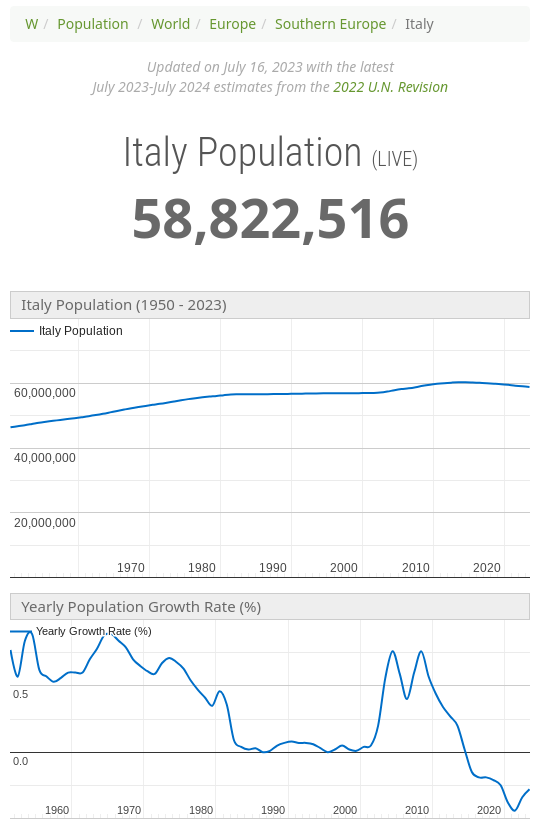
If you consider that the population was assessed in 2017 to be at barely over 60,000,000, it is quite a contraction in six years- which makes doubtful the assessment that will contract by just one million in a further six years: would imply a trend reversal.
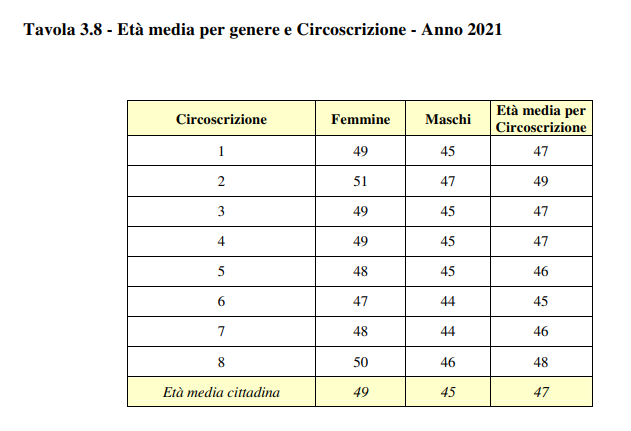
Turin is getting also older, as remembered by the Mayor few days ago, and this is the age average by "circoscrizione":
So, the town is contracting- but it is not just Politecnico graduates that are living: look at how many of the residents in 2021 were actually from Turin:
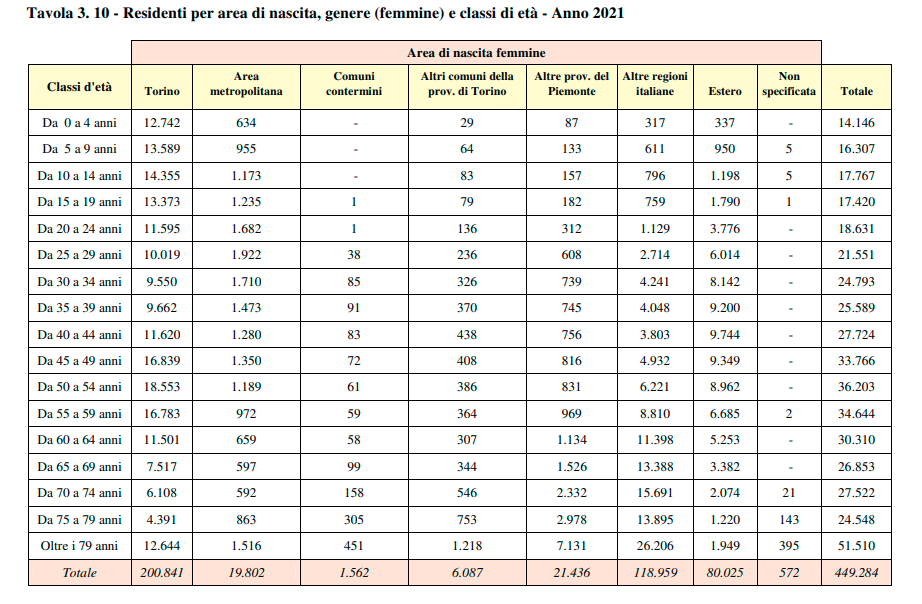
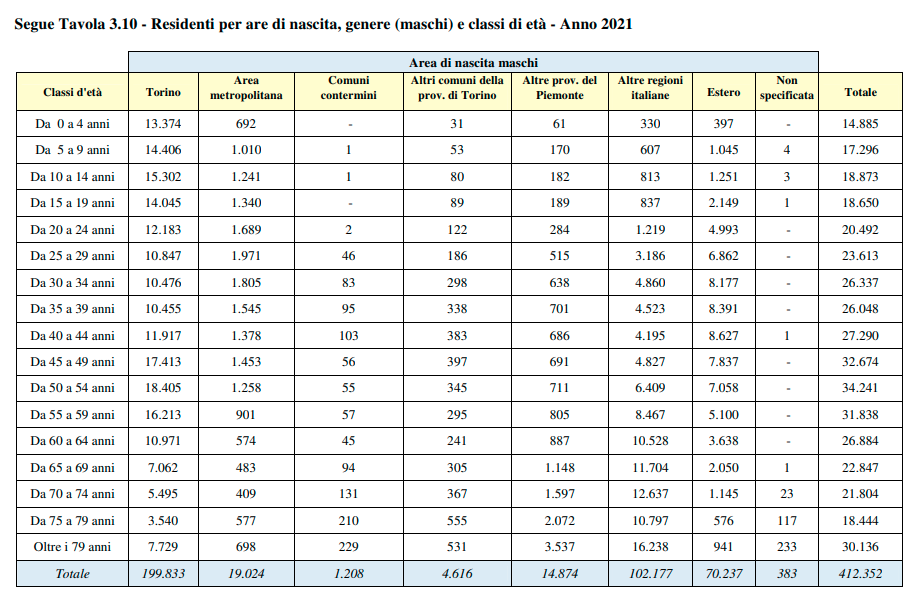
Again in table format:
_ Women: 200,841 out of 449,284, i.e. 44.7%
_ Men: 199,833 out of 412,352, i.e. 48.5%
Again, the report has different dimensions of slicing and dicing by age, sex, country or location of origin- will let you browse through it.
In the next section, will share few considerations (which actually in part already shared in past articles.
Conclusions / my preliminary take on data
I referenced this article on a Linkedin post that I shared (in Italian) this morning: the key element is to consider the whole, systemic picture, not just the population figure.
I know that, as in that article in Italian quote above, the temptation is to look at trends, do a linear regression, and see where the curve will go in 20, 40, 50, 100 years.
But, frankly, as I share both on Facebook and Linkedin, I do not think that a simple linear regression would make sense here.
Also in business applications, there are concepts as "economies of scale" or generally "scalability" that influence (accelerate or decelerate) the curve.
Both when number crunching for business or organizational change activities, I always consider the organizational perspective.
If you were to instantaneously expand a team from 5 to 50 people, you would not actually get an immediate 10x improvement, and not even a higher value.
Actually, you would probably burnout those existing 5 and lose by attrition both some of them and a chunk of those additional 45.
Why? Because it is intuitive that the transmission of the operational knowledge would absorb time of the those existing five.
Hence, a simple linear extension of what you already have in place would not be enough: you would probably have to change at least approaches and tools, if you want to quickly benefit from those additional 45.
I shared today on Facebook an interesting article from El Pais- the concepts are about something else, but in my comment shared some elements from experience on organizational development.
The reverse is also true- but in this case the flip side of scalability is often identified with the "tipping point" concept (or other similar ones).
Incidentally: that concept was part of a successful book published in 2000, but the concept was well known already in 1986 when I started officially to work.
The idea? You can read the article on Wikipedia that I linked, or even the book, but in modern terms would summarize it with "sustainability", i.e. the structural capability to deliver a product, service, etc depends on a mix of human, physical, financial, etc resources.
If you generate an unbalance in one of the various dimensions, soon you will need to rebalance the others, but eventually you will have to shrink down.
Which would generate further side-effects downstream, as below a certain level of performance you would actually create a bottleneck that would make impossible to the whole system to deliver even a fraction of what delivered before.
This applies to each one of the services that we city dwellers take for granted.
Few years ago, the Mayor of a small village in Tuscany complained taht city dwellers relocating to their village, which had 400kms of roads, assumed that they could live in a cabin but, when snow fell, roads would be immediately cleaned.
Fine if you are in a town of a million packed in buildings or building complexes of 10,000 inhabitants each, not so easy when you have few people every 5-10kms of road.
Let's consider the population contraction of Turin limited to 4,000 each year (but the trend shows something different).
This would imply 320,000 in 80 years, from 2020-2100.
It smells too much of a linear projection that ignores the sustainability side, i.e. if structurally services can be delivered.
If your citizens get older, and probably retire, but your population contracts, and your have to increase prices, it should be assessed what will happen first:
_ the volume of services shrinked too much to keep delivering the services as they were
_ the prices would raise too much to be paid by citizens.
Hence, I think that my concept that 4,000 a year could bring Turin itself to accelerate its contraction, not the metropolitan area, moving from 860,000 not to 540,000 (860-320), but to a much lower figure.
Therefore, if I were to plan for a future sustainability of services while designing the model, would get instead something closer to that "gap" between birth and death, i.e. rounding the 5,500 to 6000 (let's be conservative), assuming that by the end of the century would be probably close to 860,000 (circa the figure in 2021, which was 861,636) - 6,000 x 80 = 380,000.
So, I would add a further cut- to make it simpler, as it is a figure that you can find also in my previous articles, usually in my post refer to the figure of 350,000, i.e. use the lower of 350,000/375,000 reduction, but as a memento of who could actually be still here in a century.
Just imagine not only what would this do to services, but also to infrastructure, and how many areas are buildings would need to be converted into parks, gardens, or whatever- to avoid leaving behind even more depleted buildings than I already noticed in Turin when I returned in 2012, in former industrial but also residential+industrial areas.
With a population getting older and older, less young people will have incentives (and services attracting them) to set family in Turin, and therefore the gap between births and deaths would increase, while immigration could redress the balance only if the town can offer something that others cannot offer.
It is still a linear model- following the tipping point concept, if left alone, I doubt that would actually be linear- could actually significantly accelerate: would you like to pay increasing prices to stay in a town where continuously shops shut down in the centre, and decaying peripheral areas become breeding ground of social tensions that routinely dump their side-effects in the supposedly gentrified centre?
If you prefer to use the official figure of 4,000 (but look at the net reduction in 2021- before amendments, it was -8,884, i.e. much more than my 6,000 derived from birth-death delta rounded up, and twice the amount stated in January), then you can plan for 860,000 - 4,000 x 80 = 540,000.
Personally, when have to think about the sustainability of delivering a service or product consider the "skeleton force" / "minimal revenue" or similar concepts, when I cannot simply consider the production or service delivery costs.
Playing safe while planning adds a level of flexibility- also because anyway a redesign would be needed, unless there are measures to not just reverse the tide in terms of numbers, but also alter the mix in terms of income (the Rapporto Rota in Turin routinely noted how the mix e.g. in services was toward lower income, not higher income- hence, increasing prices for basic services would have to take that into consideration).
When I write above about acceleration, the consideration is: why do would you live in a large town?
Because it can give you access to services and security, as well as welfare, that you cannot have elsewhere- including due to your own occupation.
If those services decrease in quantity and quality while increasing in price, and if that security is affected by social decay (as shown by the increase of news items also from local authorities complaining about the evolution of the mix of residents)...
...services will start to decline gradully up to a tipping point, but doubtful anyway that will stay linear, also without all the number crunching ruminations I shared above (to retain an element of linearity, instead of moving toward a geometric progression).
Today's newspapers reported economic trends in Piedmont, shared by Confindustria, as I posted on Linkedin.
Therefore, looking at the whole picture, what would be needed, as I shared on Facebook is for the current administration not to alternate each week between announces of new events and complaints about the future of the town, but to take the initiative.
It requires obviously a model and a consensus, which have to start from shared data and shared assumptions- no small feat, in a town where the local élites seem more interested in gentrification and building a new aristocracy floating on the void,than investing on the town that apparently they are so proud about.
In my current search for missions, I had the chance to compare hundreds of "packages" offered by companies- and, in many startup that are "scaling up", there is a recurrent theme: they offer also a family-friendly environment, not just limited to the routine "work-life balance", but in many cases actual services.
In some countries, do not need to offer kindergarten, insurance for the whole family, etc- but where they are based in other countries, it is a routine to offer additional services in that area.
Personally, I would start by taking over what Marchionne opened and the new Stellantis closed: creating in this case a public kindergarten network financed by a taxation to be set by the Government on companies, as smaller families with just one-two generations (single or a couple with children) lack the traditional network of relatives needed to support a working family with children, to introduce an element of flexisecurity.
If the kindergarten is linked to a company, it is fine to retain employees, but then reduces flexibility for the companies and opportunities for employees, limiting the possibility of transitioning between businesses if demand changes.
Yes, it would take years, but probably would attract more companies with younger employees (as many abroad offer similar "family friendly" environments) than the usual incentives- and if the alternative is for the next few decades to keep complaining each January about the contraction of the population, starting from basics that would have a clear market would be more sensible than building other empty boxes to attract companies on territory that offers no services comparable to what other countries, also in EU, already deliver.
Therefore, now you understand why I nicknamed my birthplace "Macondo on Po" (Po is the main Italian river passing through Turin), and used often for my posts on Facebook this painting from Magritte:

A magnificent castle in the sky overseeing the cliffs and tides is fine within a painting, but defies political, social, economical laws of gravity...
... but it is now time to close this article, and focus on something else: more in future articles, starting from this shared basis.