 _
_Viewed 8574 times | words: 2697
Published on 2024-01-02 23:15:00 | words: 2697
As previously announced, released few days ago a dataset update relating to my data-project started in fall 2022.
This article will be short, as befits this section ("citizen audit") where I posted it (and others), whenever I want to share data.
Or: comparing what annual financial reports showed pre- and post-COVID.
The obvious starting point in 2022 was the website of Borsa Italiana, and you can find an outline of the dataset story directly within the description of the dataset that loaded on Kaggle.
I used as a point of initial reference fall 2022, but actually, as you can see from previous articles and an initial description of the dataset, actually started exploring the concept in 2022, during the phase-out of my mission started in July 2021, and started digging on data design etc in July 2022, as soon as that mission ended.
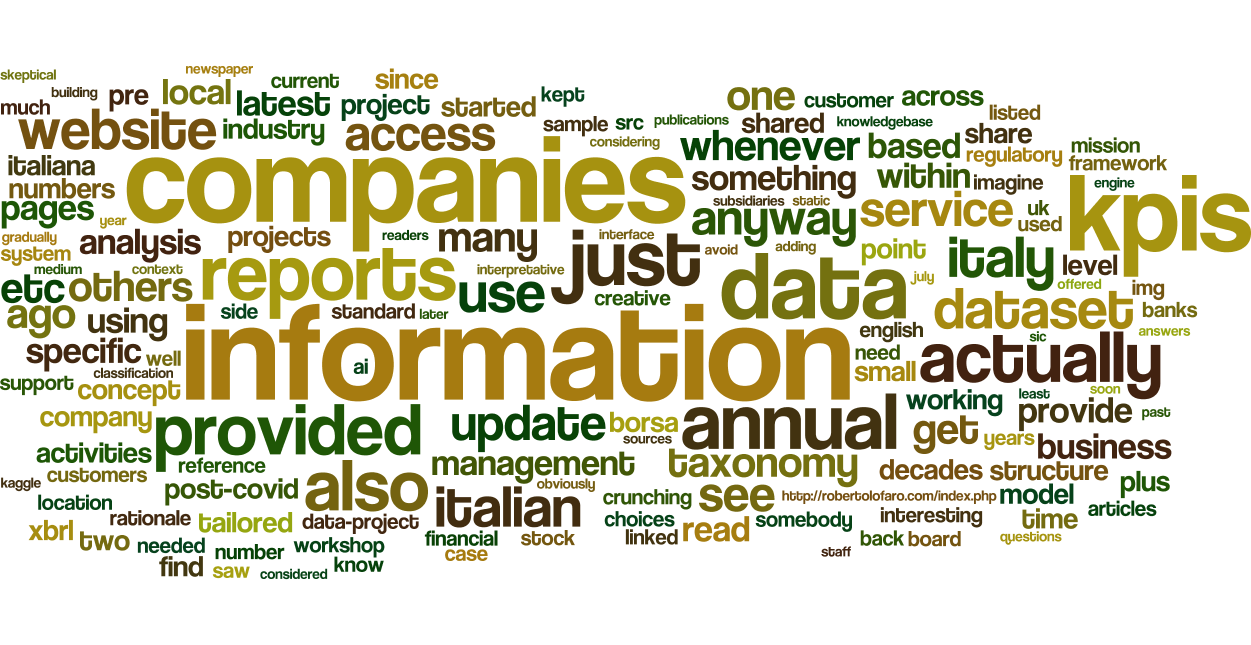
A visual summary of what is inside the annual reports for 2021 and 2022 that are concerned:
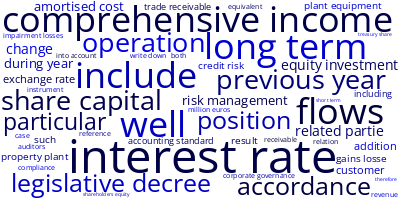
What you see in this tag cloud is derived from (selection criteria are described within the dataset linked above):
_ a subset of 113 companies listed on the Borsa Italiana
_ for each one, the annual report of both 2019 and 2021
Am I planning, for this project, to read all the annual reports?
Well, I plan to analyze, extract data to use for my KPIs, but not to read- as that would mean reading 28,804 pages for 2019 and 31,770 pages for 2021.
Maybe will find another way to "read"- but have anyway to read selectively all those 226 reports to extract not just numbers, but the "narrative" beyond those numbers, that will summarize in KPIs.
Whenever I write "KPIs", my mind goes back to all the cases since the 1980s when I had actually, across different industries, to work on KPIs or other forms of "management measuring" based on data, working with financial controllers and other senior management.
Across four decades, I read many books and listened to many presenting "the" KPIs, but what I shared today on Linkedin summarizes quite well the same position that I kept repeating, about "standard KPIs":
" might be useful as a starting discussion point (to avoid wasting workshops on the basics)
but copycat ignoring the corporate context, current status, targets, and monitoring challenges specific to your own business could be dangerous
as KPIs should not replace strategy and its implementation, but support it
also: some KPIs have the tendency of generating "creative alignment" and "consensus building", i.e. formally complying while avoiding anything that could be considered a nuisance, also if actually could help to pre-empt issues "
Meaning: I am skeptical of KPIs that do not evolve (and do not get pruned), for reasons that I discussed with more depth in other articles.
And I am equaly skeptical of the differentiating value of using standard KPIs: tailoring to the specifics is what make KPIs impactful on management.
Otherwise, KPIs risk turning into a creative convergence exercise, and turn into a placebo that makes ignore reality.
I selected for my data project companies listed on the Italian stock exchange, as just being there requires more structure, and most Italian companies are not exactly used to either transparency or management structure.
This week, I saw that the Italian business newspaper Il Sole 24 Ore is now offerering a service to carry out number crunching for businesses.
Reminded me a colleague in the UK in the 1990s, who offered a service to do number crunching using the Asset-Liabilities Model that he and his colleagues had developed, pricing the monthly service below the threshold for business spending on data services without ICT, and worked by having the customers (UK branches of foreign companies) files to the service, and receiving results.
The rationale for those UK branches of major foreign banks was the same that could apply to most Italian companies: too small to have an internal structure and internal talent, would have anyway to have a degree of compliance.
An issue that I saw common since the 1980s whenever working with multinationals- some subsidiaries are too small to cope with the level of structured information provision that they are expected to deliver, a level tailored to HQ and larger subsidiaries, not a skeleton force.
Actually, considering the quantity of data that, even before e-invoicing (but more so since was gradually spread few years ago), Italian companies of all sizes had to provide to the State, would be interesting to see a return dataflow with standard KPIs sent back to each company, along with some basic "mapping" (where you stand vs. others).
Decades ago, for a banking outsourcing customer one of the exploratory projects was to consider what would be needed to support banks (banks were both customers and shareholders) to speed-up the commercial credit application vetting for small and medium companies.
The discussion soon shifted to XBRL, and, as I routinely am used to learn when needed, registered for and attended a workshop in Rome on XBRL organized by the Bankers' association.
A nice cameo followed.
At the workshop, met actually some managers of my customer.
At the end of the workshop, when I went to pay for my attendance, I was told that it had already been settled: somebody liked my investment in continuous learning in time and money.
As I kept doing whenever I had further missions with them or others that requires what I knew or had experience of, plus something customer- or mission-specific (also in my latest mission).
Since 2010 XBRL has been in common use in Italy, and here you can find the latest version of the applicable rules.
I did not keep up-to-date with the latest, as it was not part of my later projects, but the concept, if you do not know it, is simple, and is the reason why it was considered for that project decades ago.
You saw above how many pages are in just two years for just 113 companies.
Imagine that on average an annual report has over 100 pages, and imagine that often you need not two years, but five.
Now, imagine the cost of extracting information from those 500 pages- not just the numbers, but the rationale that explains/hides some of the "creative" side.
Would be interesting if the State, using XBRL and other information that they receive or can legally have access to, were to provide to each company at least those "business-neutral" KPIs, with a comparison such as the one I proposed in late 1990s for the introduction in Italy of a risk management monitoring system at the branch level, i.e. by industry (in this case, the industry taxonomy would be standardized), location, company size / age / spread of customers / etc.~
Probably the service offered by the newspaper is based on something more tailored involving also Generative AI: why not, an analysis based on a data plus answers to some questions might "tune" an analysis model toward provided something more than off-the-shelf feed-back.
Actually, as I shared long ago, few decades ago, right after my time in summer 1994 and summer 1995 at LSE, designed and proposed a service to provide "tailored" vacations in Italy, and having local staff receiving the tourist and delivering a "personalized" view of each town.
The service was based on the same concept: an Eliza-derived PROLOG model / expert system based on an assessment of the individual and matching with a multidimensional taxonomy representing locations, "visit point", etc, using then the mix-and-match to propose itineraries, and then having local staff waiting at each "station" of the visit to give a unique perception of the specific Italian location.
Well, eventually never left the drawing board, and for regulatory, not technological reasons.
The regulatory side? In order to escort somebody somewhere as a tourist, you need to get a permit in each location.
My idea was to use students in literary and art studies (who usually in Italy get only "gig"), generating a way to both have a business and provide a chance to use (and develop) that talent, not to get stuck with local touristic oligopolies filtering access to the market using the same excuse that many Guild-based professions in Italy use: "it is for quality", while instead is more for market control.
With current technology, building "recommendation systems" is potentially easier and cheaper that with my chosen tools of the past (you do not need anymore a "complete" knowledgebase), and there is a regulatory convergence to streamline compliance EU-wide.
And, actually, while at the time would have needed to create the knowledgebase with reference to locations (early Internet times, in Italy), nowadays "scraping" from local authorities plus augmented local information collection and "antennas" could help.
For my own data-projects and data-products, actually in many of the projects and products where in the past had to split between the "engine" behind and the "user interface" getting from questions to answers (practically, converting myself into a "ChatBot" to convey information to the engine), while with current technologies most of the "human role as interface toward the system" could be assigned to a conversational AI model tailored to the specific domain, maybe just by recycling a commercial one and adding on top a "layer" of domain-specific or proprietary knowledge.
Instead of adding new datasets, I will keep updating the existing one linked above.
I wrote about this data-project few times before, and I will share here again just a couple of links:
_ Reading pre- and post-COVID corporate narratives, the Italian case: a dataset in fieri
_ Looking at pre- and post-COVID : decomposition by industry
What will be next? Some more charts and other approaches to summarize, compare, and show evolutions.
If Italy were to use across the board in any public website something akin to the USA SIC, I would obviously share quantitative analysis by SIC.
Unfortunately, as I shared in previous articles linked above, the "industry" associated with companies on Borsa Italiana website uses a unique taxonomy.
Technically, if you know the "ticker" of a company listed on many stock exchanges, you could get that information into your own spreadsheet- for free.
In my case, as I was interested in data within annual financial reports, the constraints created to avoid giving access in real-time to stock prices and other related information were not that much limiting.
Anyway, I had decided to get through the BorsaItaliana website to see:
_ the level of information provided, i.e. if the website was an "equalizer"
_ how much information was disclosed, across the board
_ if the information provided was enabling comparing companies
_ if a taxonomy (i.e. classification) of companies was provided
_ which analyses the structure of information and taxonomy allowed.
As I shared within the dataset update history, gradually had to consider that, also when information could be extracted via Google and Yahoo, from a sample of annual reports that looked at it seemed that, as it has been a tradition in Italy, unless you had access to the "small print" that traditionally is attached, there was too much interpretative latitude within some figures.
Also, most of the information about companies, beside annual reports that you could find on their own websites, was a matter of voluntary disclosure and maintenance.
Examples:
_ some companies provided a reclassification of their own annual reports and evolution, others almost no information, and not even a link to a website
_ others provided information, but then their own "investors relations" link bounced around
_ others provided information, had an "investor relations" website section- but it was partially filled
_ etc etc.
Anyway, considering that the project was about data that remained "static", it was in the back burner vs the weekly update on ECB communication and monthly AI Ethics Primer update, plus other projects.
So, through a series of choices over the last year, finally the latest update identified 113 companies that had the following characteristics:
_ filled the optional information online, i.e. were willing to have an interesting degree of transparency
_ provided annual reports for both 2019 and 2021 on their websites
_ provided such reports also in English (to ease access to readers).
To show the progression, whenever updated the dataset kept "expanding" a Jupyter notebook that released on Kaggle.
So, moved from this picture:
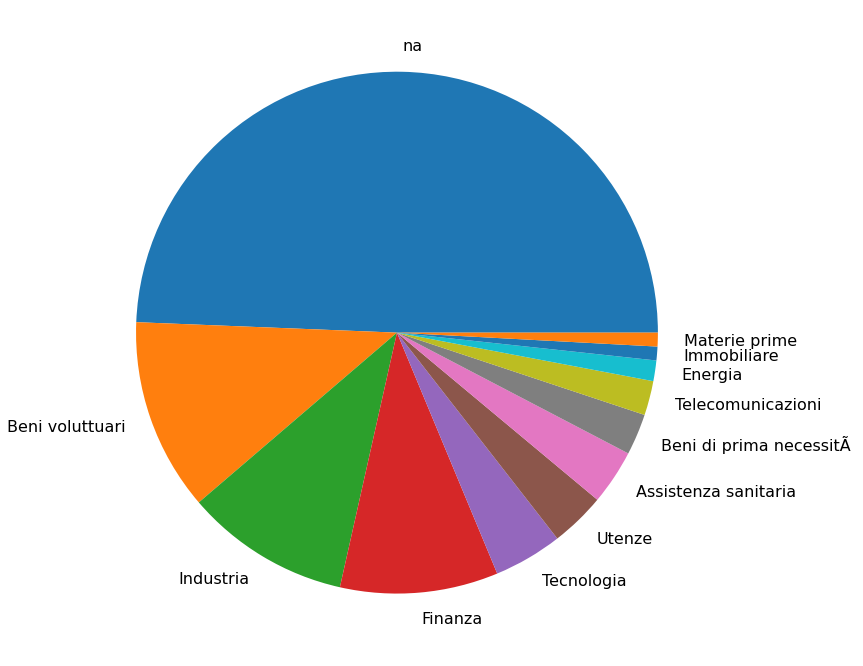
to this picture:
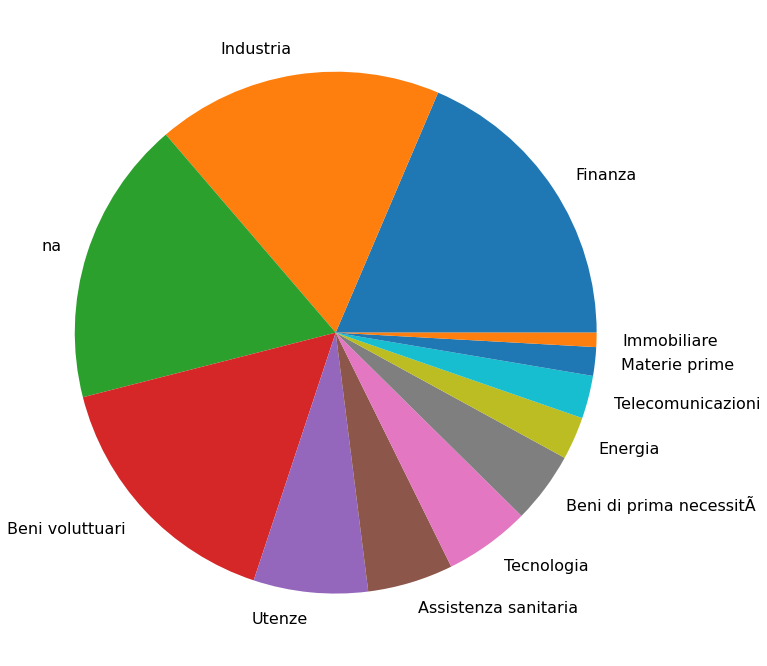
What is that large "unknown" that shrinked down in the latest pie chart?
Simply- companies for which the taxonomy association provided on the Borsa Italiana website was not shown at the reference date.
The reason why the balance switched between the two? Most of those "unknowns" did not provide annual reports in English.
Anyway, choosing English was not just to allow easier access to readers, but also for the purpose of my publications.
There are at least three levels of analysis that I working on, and why I selected this specific theme:
_ communication- to see how companies dealt with the context pre- and post-COVID
_ financially- to see the impact on numbers (not just profits, but also some basics)
_ structurally- to see how companies changed on the operational side.
Obviously, while the second is a matter of number crunching public data and the associated explanatory notes, the other two areas require some specific choices.
Anyway, whenever working on KPIs (Key Performance Indicators) on business activities, unless you are the one setting the "reporting framework", and therefore deciding not just "what" has to be reported, but also "how" is to be composed and "who" is accountable for any mis-reporting, the first step should be to build a "datamart" in few steps:
_ select what should be included
_ add information "as is"
_ then, apply interpretative "harmonization rules"
_ document each and every alteration, its rationale, and positive/negative choices
_ then, use for each any further analysis the result of this activities.
These steps are to ensure that, if you were to update the sources, or somebody were to "reuse" the framework but with a different framework, would know how to adapt.
The next publication update on this data-project will be actually about its first release of a data-product to access information, later this year.
The concept is of course that, while I am taking my time as anyway my target is "static" (2019 and 2021) and for me is just something to support some publications activities (and test some concepts that will eventually use in my activities, i.e. a continuous learning opportunity- including about the Italian economy), whenall the paraphernalia will have been defined (sources, data design, data pipelines, datamart, models, etc), it could be reused.
Stay tuned!